AKDITAL: Strong Growth and Bull Momentum A Buying Opportunity?Akdital: An Opportunity to Watch in the Healthcare Sector
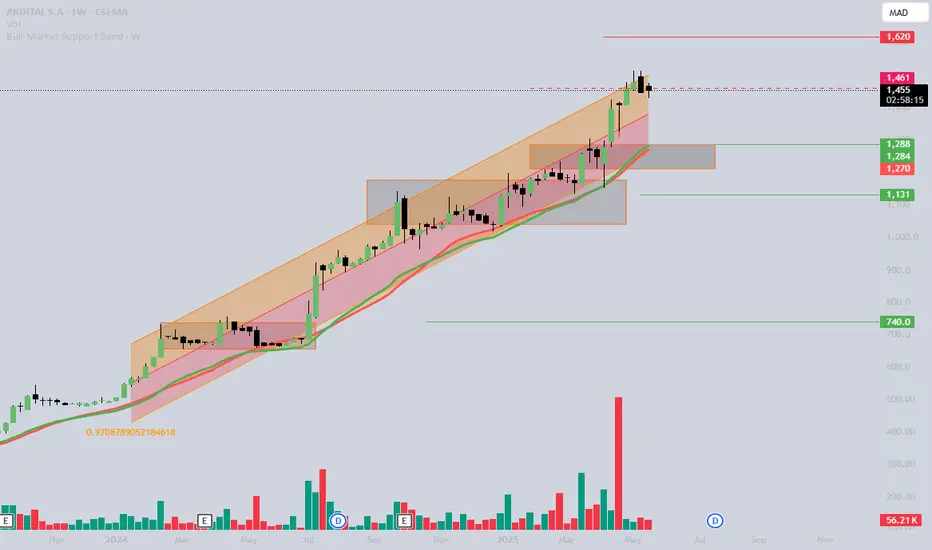
Akdital’s stock continues to show interesting momentum. Currently trading around 1,455 MAD, it benefits from solid fundamentals and technical signals that deserve attention.
What’s driving Akdital’s value?
Strong earnings growth (+76%), reaching 511 million MAD, proving the company’s profitability.
Strategic expansion, with new clinics opening, including through the MGPAP partnership in Laâyoune.
Increasing demand for private healthcare services, supported by favorable policies.
Shift to third-party payment, improving accessibility to care and long-term profitability.
What the charts are saying
Uptrend confirmed, backed by solid trading volumes.
Key support at 1,432 MAD, a good entry opportunity in case of a pullback.
Major resistance at 1,740 MAD, a breakout here could trigger another rally.
Belkhayate Cycle at -24.49, indicating potential bullish reversal ahead.
Valuation and strategy
EPS estimated at 36.10 MAD, reflecting financial strength.
Intrinsic value estimated at 794 MAD, based on a sector P/E of 22.
Bullish scenario: Break above 1,740 MAD could open the door to 2,000 MAD.
Bearish scenario: Consolidation towards 1,432 MAD, offering a better entry before another surge.
Key risks to monitor
Pace of expansion: If too fast, it could put pressure on margins.
Reimbursement policies and their financial impact.
Resistance at 1,740 MAD, which could lead to temporary consolidation before a breakout.
Conclusion
Akdital presents strong potential, backed by robust financial performance and a well-planned expansion strategy. The breakout of 1,516 MAD will be critical in confirming the bullish continuation.
CMGP Group – Investment Opportunity on the Casablanca Stock Exc CMGP Group – Investment Opportunity on the Casablanca Stock Exchange!
In-depth analysis for investors interested in Moroccan stocks!
CMGP Group is showing strong growth, with revenue up +12.2%, reaching 2.327 billion MAD.
Technical Price Analysis: Key Support Zone: 340 MAD – Watching for a reaction and potential rebound. Major Resistance Level: 350 MAD – A breakout could confirm bullish momentum.
-EPS & Valuation: 10.76 MAD , with an estimated intrinsic value of 220 MAD.
Why Watch CMGP Group? Rapid expansion in West Africa (Ghana, Senegal, Mauritania) Strong positioning in sustainable agriculture and solar energy Impressive profit growth of +49.1%
Investment Strategy Bullish Scenario: Buy after breakout 340-350 MAD, target 350-380 MAD. Bearish Scenario: Breakdown below 340 MAD, target 330 MAD.
Interested in Moroccan stocks too? Follow my insights on @GoldenZoneFX What’s your view on CMGP and the Casablanca Stock Exchange? Let’s discuss!

ADI SHORTwe have been keen observers of Moroccan real estate stocks since June 2023. after a spectacular two-year run, they have (ADH, ADI, & RDS) started showing signs of exhaustion.
ADI has formed a classic Head & Shoulder pattern signifying a potential reversal of the bullish trend. we will be looking to short once the recent retracement is complete.
bonus: ADH is also retracing after forming a double top.

SLF Longthe note on the screen says it all. purely technical. if price falls below the indicated level (20% downside) the trade will be invalidated.

RES DAR SAADA (RDS) Stock Analysis - Casablanca Stock ExchangeOverview and Current Price Movement:
The stock is currently 25% down from its all-time high (ATH) of 100. This decline indicates a correction phase after a significant rally.
The price is approaching a critical support zone, which aligns with the daily 200 moving average.
Historically, this moving average acts as a dynamic support level for many stocks, offering a potential entry point for long-term investors.
Entry Price and Risk Assessment:
Optimal entry price: The chart suggests an entry point of 72-73. This range is based on a confluence of technical factors, including:
Proximity to the 200 moving average.
The stock's recent support levels.
Maximum drawdown risk: A potential drawdown to the 61-63 range represents a 10-12% downside risk. This is the worst-case scenario if the stock breaks below key support levels.
Price Targets:
Conservative Price Target (TP1):
Target Price: 87.50
This represents a 20% upside from the optimal entry point. The price aligns with previous resistance levels and fits within a shorter-term recovery rally.
Optimistic Price Target (TP2):
Target Price: 100
This level represents a full recovery to the ATH, offering a 37% upside. The target is more achievable under a strong bullish trend, potentially driven by market catalysts or favorable earnings.
Technical Patterns and Indicators:
The chart indicates a descending triangle, a pattern often associated with bearish continuations. However, in this case, the price is near a breakout zone, which could result in upward momentum.
Key Resistance Levels:
The stock has tested resistance levels around 87-90 multiple times, making this a critical level for bullish confirmation. A breakout here may fuel the rally toward TP2.
Support Strength:
The 72-73 range has demonstrated strong buying interest in the past, making it a reliable level for entering trades with reduced downside risk.
Strategy Recommendations by @dogofwallstreets
Buy at 72-73:
Place limit orders within this range to capitalize on the optimal entry opportunity.
Stop-Loss Placement:
Consider placing a stop-loss around 61, which aligns with the worst-case scenario. This ensures risk is limited to 10-12% of capital.
Profit-Taking:
Start taking profits at 87.50 (TP1). For more aggressive strategies, hold until 100 (TP2), especially if the price action shows bullish momentum.
Here’s a detailed market analysis based on your chart for RDS (Res Dar Saada):
Overview and Current Price Movement
The stock is currently 25% down from its all-time high (ATH) of 100. This decline indicates a correction phase after a significant rally.
The price is approaching a critical support zone, which aligns with the daily 200 moving average. Historically, this moving average acts as a dynamic support level for many stocks, offering a potential entry point for long-term investors.
Entry Price and Risk Assessment
Optimal entry price: The chart suggests an entry point of 72-73. This range is based on a confluence of technical factors, including:
Proximity to the 200 moving average.
The stock's recent support levels.
Maximum drawdown risk: A potential drawdown to the 61-63 range represents a 10-12% downside risk. This is the worst-case scenario if the stock breaks below key support levels.
Price Targets
Conservative Price Target (TP1):
Target Price: 87.50
This represents a 20% upside from the optimal entry point. The price aligns with previous resistance levels and fits within a shorter-term recovery rally.
Optimistic Price Target (TP2):
Target Price: 100
This level represents a full recovery to the ATH, offering a 37% upside. The target is more achievable under a strong bullish trend, potentially driven by market catalysts or favorable earnings.
Technical Patterns and Indicators
Descending Triangle Pattern:
The chart indicates a descending triangle, a pattern often associated with bearish continuations. However, in this case, the price is near a breakout zone, which could result in upward momentum.
Key Resistance Levels:
The stock has tested resistance levels around 87-90 multiple times, making this a critical level for bullish confirmation. A breakout here may fuel the rally toward TP2.
Support Strength:
The 72-73 range has demonstrated strong buying interest in the past, making it a reliable level for entering trades with reduced downside risk.
Strategy Recommendations
Buy at 72-73:
Place limit orders within this range to capitalize on the optimal entry opportunity.
Stop-Loss Placement:
Consider placing a stop-loss around 61, which aligns with the worst-case scenario. This ensures risk is limited to 10-12% of capital.
Profit-Taking:
Start taking profits at 87.50 (TP1). For more aggressive strategies, hold until 100 (TP2), especially if the price action shows bullish momentum.
Market Sentiment and Outlook:
The stock's 200 moving average proximity and strong support zones suggest the potential for a rebound. However, any breakdown below 61-63 would signal further weakness.
A rally to the optimistic target is plausible if overall market conditions improve or if the company releases favorable updates.
Conclusion:
RDS (Res Dar Saada) is currently in a pivotal phase, offering a promising risk-reward ratio. The suggested entry range of 72-73 provides an excellent opportunity for both short-term gains (TP1: 87.50) and long-term upside (TP2: 100). Traders should monitor price action closely, especially around key support and resistance levels.

Comprehensive Toolkit for Trading on Casablanca Stock Exchange CasaBourse is a trading application dedicated to the Casablanca Stock Exchange, designed to help investors make informed decisions. It offers:
Comprehensive Analysis: Based on tradingview Data : Access to market indicators to assess stock performance.
Advanced Analysis Tools: Powerful tools for technical and fundamental analysis.
Intuitive Interface: Easy navigation for quick access to essential information.
Real-Time Updates: Stay informed about the latest trends.
Download CasaBourse for successful trading and achieve your financial goals!
Option 2:
In ZIP format: The application is in a ZIP file. Use a file manager or the Zarchiver app to open the ZIP.
CasaBourse.zip

On the way to 600 DHs...watch closely!Based on my in-depth analysis, I remain confident and am maintaining my buy position on Alliances shares, despite the 23% gain already achieved. The indicators show me that the stock can easily reach the 600 DHs level, unless the market makers decide to change their strategy....

AKDITAL S.A DAILY ANALYSIS After retracement and rejection FVG 2 times we will see an expansion to fill gap and fvg of down trend and continuation of up trend

AKDITAL S.A ANALYSIS
after rejection volume imbalance and confirmation with next candle we will see an expansion to break lwvwl of 960 and continuation of up trend

Cosumar stock analysis for long term investingIf the price broke last week we can consider buying the price
Close the deal when the price reaches the first ring high, and exit at the suggested exit point
good luck for everbody

Price reached a strong resistance level (+5 years)Looking at the chart historically the price kept respecting the resistance level highlighted in red for over 5 years, with that it is safe to assume a short position is a logical move.

une correction a venic de l'action AKT (MARCHE MAROCAIN)l'action AKT, je pense qu'il a atteint son objectif, attendez à une correction

IAM ,Buyers are pushing to major levels ,what's next ?Hello ladies and gentleman ,According to my analysis of IAM ,I see that buyers return to push the price to our major levels 113 -143 "+40%",which is supported by a big bearish volume that indicates that we may see a reversal in the coming days ,also we will be looking for buying opportunities if we got a good confirmation in the levels between 88-94,that's why we'll be observing the market in the next days to get the opportunity to enter in earlier stage of the movement
I hope you appreciate my analysis ,If you have any suggestions ,please write it below to discuss it.

AKT WEEKLY ANALYSIS after the rejection of the price a second time at the level of the resistance we will see a correction of the price to fill FVG '' Fare Value Gap'' then we will have a continuation of the upward trend


AFRRIQUIA GAZ MOROCCO dear investors marker is bearish and it create a flag pattern to the down side if price breaks above 4300 it may go up until 5800 and if he breaks below 3500 it may go down to 2440 trade safe and good luck
