
HERMES-STRATEGIC MEDIUM/LONG TERM BUY !Following the sharp decline (-30.85 %), since the ATH @ EUR 1678.00 reached on December 1st, 2021, the price action triggered an HAMMER (reversal pattern) coupled
with a RSI BULLISH DIVERGENCE, which is a first positive signal calling for a trend reversal towards higher levels.
Important to also note that a potential DOUBLE BOTTOM is in progress (first bottom having been reached on October 1st, 2021 @ 1'166.50 !
Today's ongoing price action (long white candle) is, for the time being confirming this reversal and a closing level, on a DAILY BASIS, ideally above the Tenkan-Sen or Conversion line (@ 1'257.80) would
add further support to this expected bullish scenario.
IMPLICATIONS :
UPSIDE :
Once this first resistance level will be broken, focus will be on the second resistance area (cluster of both Kijun-Sen or Base line (1288) and the MId Bollinger Band-(1298) -"my own Barometer !", for further development
(on this daily time frame, BULLISH above and BEARISH below the Mid Bollinger Band (MBB).
The ongoing downtrend resistance line (in red), currently around 1'380 would be the next resistance level to look at ahead of the Daily clouds area (currently very thin) and close to the 61.8% Fibonacci retracement @ 1480.50.
A clear upside breakout of the top of the clouds would reopen the door for a new attempt of ATH.
DOWNSIDE :
Former low @ 1'160.50 is the first support to look at and any dips towards this level should be seen as consolidative move in a new uptrend.
Main focus will remain on the WEEKLY CLOUDS SUPPORT AREA (1'200-1'025) with intermediate support @ 1'097,00 this level being the 50% Fibonacci retracement of the big rally which started @ EUR 516.00 in March 16, 2020
CONCLUSION :
HERMES is a diamond, very well managed and fundamentally exceptional !
Therefore, STRATEGIC LONG EXPOSURE SHOULD BE BUILT FROM CURRENT LEVEL AND ON DIPS AS A REAL VALUE ADDED ON ANY PORTFOLIO.

ASM: Descending Triangle Break Incoming? ASM International - Short Term - We look to Sell a break of 279.90 (stop at 291.90)
The medium term bias remains bearish. Trades with a bearish descending triangle formation. A break of bespoke support at 280.00, and the move lower is already underway. After strong selling pressure at the start of the week the pair consolidated yesterday with little net change and all price action within the lower half of the previous day's range.
Our profit targets will be 252.10 and 233.00
Resistance: 310.00 / 350.00 / 400.00
Support: 280.00 / 250.00 / 220.00
Disclaimer – Saxo Bank Group. Please be reminded – you alone are responsible for your trading – both gains and losses. There is a very high degree of risk involved in trading. The technical analysis, like any and all indicators, strategies, columns, articles and other features accessible on/though this site (including those from Signal Centre) are for informational purposes only and should not be construed as investment advice by you. Such technical analysis are believed to be obtained from sources believed to be reliable, but not warrant their respective completeness or accuracy, or warrant any results from the use of the information. Your use of the technical analysis, as would also your use of any and all mentioned indicators, strategies, columns, articles and all other features, is entirely at your own risk and it is your sole responsibility to evaluate the accuracy, completeness and usefulness (including suitability) of the information. You should assess the risk of any trade with your financial adviser and make your own independent decision(s) regarding any tradable products which may be the subject matter of the technical analysis or any of the said indicators, strategies, columns, articles and all other features.
Please also be reminded that if despite the above, any of the said technical analysis (or any of the said indicators, strategies, columns, articles and other features accessible on/through this site) is found to be advisory or a recommendation; and not merely informational in nature, the same is in any event provided with the intention of being for general circulation and availability only. As such it is not intended to and does not form part of any offer or recommendation directed at you specifically, or have any regard to the investment objectives, financial situation or needs of yourself or any other specific person. Before committing to a trade or investment therefore, please seek advice from a financial or other professional adviser regarding the suitability of the product for you and (where available) read the relevant product offer/description documents, including the risk disclosures. If you do not wish to seek such financial advice, please still exercise your mind and consider carefully whether the product is suitable for you because you alone remain responsible for your trading – both gains and losses.

MT to Head Back to Support? ArcelorMittal - Short Term - We look to Sell a break of 28.39 (stop at 29.95)
Bespoke resistance is located at 29.00. Price action has posted a bearish Shooting Star and is negative for short-term sentiment. Previous support located at 24.50. Trading within the Channel formation. The bias is still for lower levels and we look for any gains to be limited.
Our profit targets will be 24.50 and 23.15
Resistance: 29.00 / 32.00 / 35.00
Support: 25.50 / 24.00 / 22.00
Disclaimer – Saxo Bank Group. Please be reminded – you alone are responsible for your trading – both gains and losses. There is a very high degree of risk involved in trading. The technical analysis, like any and all indicators, strategies, columns, articles and other features accessible on/though this site (including those from Signal Centre) are for informational purposes only and should not be construed as investment advice by you. Such technical analysis are believed to be obtained from sources believed to be reliable, but not warrant their respective completeness or accuracy, or warrant any results from the use of the information. Your use of the technical analysis, as would also your use of any and all mentioned indicators, strategies, columns, articles and all other features, is entirely at your own risk and it is your sole responsibility to evaluate the accuracy, completeness and usefulness (including suitability) of the information. You should assess the risk of any trade with your financial adviser and make your own independent decision(s) regarding any tradable products which may be the subject matter of the technical analysis or any of the said indicators, strategies, columns, articles and all other features.
Please also be reminded that if despite the above, any of the said technical analysis (or any of the said indicators, strategies, columns, articles and other features accessible on/through this site) is found to be advisory or a recommendation; and not merely informational in nature, the same is in any event provided with the intention of being for general circulation and availability only. As such it is not intended to and does not form part of any offer or recommendation directed at you specifically, or have any regard to the investment objectives, financial situation or needs of yourself or any other specific person. Before committing to a trade or investment therefore, please seek advice from a financial or other professional adviser regarding the suitability of the product for you and (where available) read the relevant product offer/description documents, including the risk disclosures. If you do not wish to seek such financial advice, please still exercise your mind and consider carefully whether the product is suitable for you because you alone remain responsible for your trading – both gains and losses.

ALO.PA at ideal retracement rang for long term accumulation v1.1Long term highly likely to profit from major ESG investments of the EU.
Short term need higher high to confirm bottom is in, will update upside target once 1-2 setup is clear.
RSI and stochastic indicate leaving oversold zone and ready to take off.
Disclosure:
Long term holding will be re-evaluated after reaching 50 and 65 respectively, to cut loose if 26.85 cannot hold.
Short term plays, already bought Sep 2022 calls, strike 40 & 45, plan to take profit starting at 38.
Important update from last publication:
Note that prices are split/dividend adjusted and in EUR, there was a big special dividend in Jul 2019 and a 2:1 split in 2008.

ONTEX Key levels, Analysis & TargetsONTEX Key levels, Analysis & Targets
Time frame D1 Bullish Divergences in MACD & RSI Indicator

EDP SHORT AND LONGEDP is a Portuguese Electricity Provider Company. Following some previous patterns of previous years I show here two of the possibilities I believe it will happen and how I will play them. Even though this weekend there were some news regarding China Three Georges increasing their share on EDP the market still shown a down trend. I am already on short position until it reaches the target support area 1. After that area is reached if it keeps breaking down I will enter again on short positions and sell on two different stages until the support area 2.
If on either of the support areas there is a strong pullback I will wait until it breaches previous support lines and buy long positions and sell at new high support line close to 6€.
I believe this increase will happen not only due to patterns, but also due to some good company investments on new renewable energy sites and technologies, and eventually the increase of China Three Georges companies shares will keep pushing the company on a good path and increase its value.
Feel free to share your thoughts as my view doesn't mean it is the correct.

Long-term bullish Just Eat Takeaway (strong fundamentals)Just Eat takeaway (TKWY) is one of the current market leaders within Europe. The company connects restaurants and costumers in 9 European countries.
According to the company´s given information, they are the current market leaders in the countries: Netherlands, Belgium, Germany, Austria and Poland. This information is based on: amount of restaurants, orders and their gross share.
Support and resistance levels show the price is on a strong support level right now.
Entry: 37-39
Tp1: around 61 (resistance level)
Tp2: above 70-75 (mid-term)
Long-term target: around 95 - 100
Other resistance levels could show places to take profit.
Not financial advice.

Unilever point towards a collapse/bear market!Hi all,
Do I need to say more? Check the weekly chart of Fugro and see what happened after a triangle that formed for about 3 years (2011-2014). This one has been forming for about 2,5 years... Unilever made an early top in September 2019 and according to my own theory, sometimes gives big hints of what is to come or a big top or bottom in the overall market...
An alternative (which is not drawn in the chart) is that the blue 'D' should be the recent spike low and the E is still to be made (so we could go a little higher). For me it is potato/potatoe, I am in a put position and waiting for the move down. :)
I wish you all the wisdom to stay safe in the bear market that has started as of November 2021 (divergent higher high in America (ES for example) compared to Europe per the beginning of January). I am early to call this (it has been my preferred scenario since the middle of 2021), though I have been silent on TradingView and I will remain silent in the future (to busy with work and family life). I believe in this scenario until proven otherwise. So I act accordingly with my different option positions. ;)
So see this as a little present and enjoy it. ;)
Shalom,
Im

ASML bounce from here?ASML has been down close for 5 weeks in a row. Looks like a strong pivot here, need to bounce and fill the opened gap asap otherwise things going to get hectic.
AMG goal € 38AMG goal € 38.
Fibonacci trading analysis tells us that the end of the growth can be € 38, because of the 0.326 range.


Short term TKWY Bullish signalAfter a major drop in the stock price a short-term bullish correction is expected. The stock is still undervalued so on long-term I'm bullish although the technicals have not confirmed that yet. For now short term bullish EURONEXT:TKWY NASDAQ:GRUB

Veolia volatility where there should be none!So, what should be quite a boring steady company has become embroiled in a bitter battle with a rival company.
Veolia (12.5B market cap) are trying to buy Suez (10.4B), one of their main competitors.
This started by Veolia talking to Suez but from the get go Suez were not interested.
Let's consider this, Suez Canal opened in 1869, Suez the company has it's origins from that. You can imagine a french company with that much history is not really going to roll over and give up their name too easy.
There is a lot of overlapping areas between the two companies, you can see how the word synergy would be applied perfectly in this situation.
Veolia has bought just under 30% of Suex from Engie which was in turn owned in part by the French government (that also caused controversy), sale is now complete and Veolia have attempted to parlay with Suez with no great success.
At the moment Suez is trying to put together a better offer to the board and shareholders but it seems unlikely that they will be able to do that.
So where will the share price go?
After the offer there was a brief rise but generally the shares of the purchasing company drop in a situation like that and the shares of the company being purchased rise, this is usually a short term situation as was the case here, Veolia was fantastic value when it hit the low here of 16 with a quick recovery always assured. Full disclosure my BEP is around 14.
So more than likely Veolia will prevail, they are one fo the biggest players in water treatment and waste in Europe/World and this would cement that position on the world stage. Initially there may be another dip in the next year but despite the difficulties that are coming down the road and the amount of debt Veolia will have to take on to purchase Suez it's hard to see anything but positive over the longer 3 - 5 year term.
Veolia are quite an innovative company, they have green credentials that are genuine and will be a force in the future.
My initial target would be 25 euro/20% increase short term, in 3 to 5 years when the dust has settled and cost savings/synergy has borne fruit I think you are easliy looking at 100%
Today Veolia issued a negative interest 6-year bond for 700m which was over-subscribed, this gives some indication of the investor interest and profile of Veolia


Prosus Staying Rangebound?Prosus - Short Term - We look to Buy at 68.11 (stop at 65.01)
We look to buy dips. Trading within the Channel formation. Previous support located at 68.00. Previous resistance located at 80.00. The bias is still for higher levels and we look for any dips to be limited.
Our profit targets will be 77.39 and 80.50
Resistance: 80.00 / 90.00 / 100.00
Support: 68.00 / 65.00 / 60.00
Disclaimer – Saxo Bank Group. Please be reminded – you alone are responsible for your trading – both gains and losses. There is a very high degree of risk involved in trading. The technical analysis, like any and all indicators, strategies, columns, articles and other features accessible on/though this site (including those from Signal Centre) are for informational purposes only and should not be construed as investment advice by you. Such technical analysis are believed to be obtained from sources believed to be reliable, but not warrant their respective completeness or accuracy, or warrant any results from the use of the information. Your use of the technical analysis, as would also your use of any and all mentioned indicators, strategies, columns, articles and all other features, is entirely at your own risk and it is your sole responsibility to evaluate the accuracy, completeness and usefulness (including suitability) of the information. You should assess the risk of any trade with your financial adviser and make your own independent decision(s) regarding any tradable products which may be the subject matter of the technical analysis or any of the said indicators, strategies, columns, articles and all other features.
Please also be reminded that if despite the above, any of the said technical analysis (or any of the said indicators, strategies, columns, articles and other features accessible on/through this site) is found to be advisory or a recommendation; and not merely informational in nature, the same is in any event provided with the intention of being for general circulation and availability only. As such it is not intended to and does not form part of any offer or recommendation directed at you specifically, or have any regard to the investment objectives, financial situation or needs of yourself or any other specific person. Before committing to a trade or investment therefore, please seek advice from a financial or other professional adviser regarding the suitability of the product for you and (where available) read the relevant product offer/description documents, including the risk disclosures. If you do not wish to seek such financial advice, please still exercise your mind and consider carefully whether the product is suitable for you because you alone remain responsible for your trading – both gains and losses.

Carrefour: Bullish Flag PatternCarrefour - Short Term - We look to Buy a break of 18.15 (stop at 17.62)
Posted a bullish Flag formation. A break of 18.00 is needed to confirm the outlook. 20 1day EMA is at 17.30. The stock is expected to outperform in its sector. 17.50 continues to hold back the bears.
Our profit targets will be 19.99 and 21.10
Resistance: 18.50 / 20.00 / 22.00
Support: 17.50 / 17.00 / 16.50
Disclaimer – Saxo Bank Group. Please be reminded – you alone are responsible for your trading – both gains and losses. There is a very high degree of risk involved in trading. The technical analysis, like any and all indicators, strategies, columns, articles and other features accessible on/though this site (including those from Signal Centre) are for informational purposes only and should not be construed as investment advice by you. Such technical analysis are believed to be obtained from sources believed to be reliable, but not warrant their respective completeness or accuracy, or warrant any results from the use of the information. Your use of the technical analysis, as would also your use of any and all mentioned indicators, strategies, columns, articles and all other features, is entirely at your own risk and it is your sole responsibility to evaluate the accuracy, completeness and usefulness (including suitability) of the information. You should assess the risk of any trade with your financial adviser and make your own independent decision(s) regarding any tradable products which may be the subject matter of the technical analysis or any of the said indicators, strategies, columns, articles and all other features.
Please also be reminded that if despite the above, any of the said technical analysis (or any of the said indicators, strategies, columns, articles and other features accessible on/through this site) is found to be advisory or a recommendation; and not merely informational in nature, the same is in any event provided with the intention of being for general circulation and availability only. As such it is not intended to and does not form part of any offer or recommendation directed at you specifically, or have any regard to the investment objectives, financial situation or needs of yourself or any other specific person. Before committing to a trade or investment therefore, please seek advice from a financial or other professional adviser regarding the suitability of the product for you and (where available) read the relevant product offer/description documents, including the risk disclosures. If you do not wish to seek such financial advice, please still exercise your mind and consider carefully whether the product is suitable for you because you alone remain responsible for your trading – both gains and losses.

ADYEN Reaches the COVID Bottom of this ChannelEURONEXT:ADYEN has just reached the point I have been anticipating since my stream on 16 December 2021. In the sloped trend lines I have drawn, the current price aligns directly with the COVID bottom in March 2020. I'm trying to find other signs of reversal, but I can't find any except the wick on the current candle which still has three trading days to close.
I would like to keep this in sight. Looking at the S&P500, I concluded in yesterday's stream that we will not get a V-shaped recovery this time. I believe some stocks will get a V-shaped recovery, but not the S&P500 as a whole. I anticipate a slow recovery for Adyen until RSI, MACD and moving averages catch up with the big drop.
Like this idea if you're interested and would like to see a follow-up.

Hermes Reversing. RMSClassical play here. End of the 5 wave ride, now zigzagging. This is accompanied by a divergence, dropping momentum and sloped downward moves. Goodluck out there!
We are not in the business of getting every prediction right, no one ever does and that is not the aim of the game. The Fibonacci targets are highlighted in purple with invalidation in red. Fibonacci goals, it is prudent to suggest, are nothing more than mere fractally evident and therefore statistically likely levels that the market will go to. Having said that, the market will always do what it wants and always has a mind of its own. Therefore, none of this is financial advice, so do your own research and rely only on your own analysis. Trading is a true one man sport. Good luck out there and stay safe!


Time to return to rationalityADYEN is being dumped into oblivion for apparently no reason. Time get rational and regain some of the losses

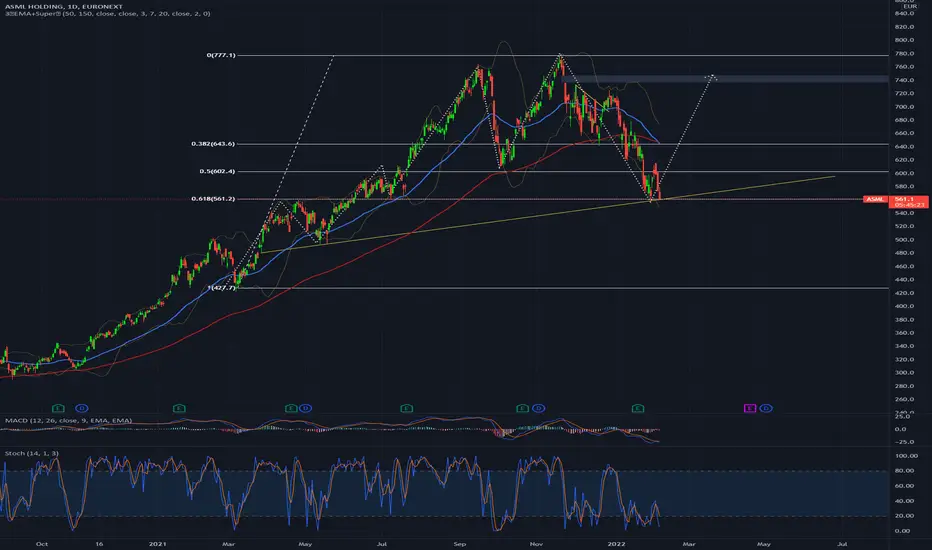
ASML LONG @565Looks like ASML is about to retest 565, might start accumulating more from here for a long term bag.
