rip this shitcoin. hope u got outrip this shitcoin. hope u got out....................................


RECSI,Breakout from falling wedge?Bullish falling wedge pattern is forming after breakout from major resistance. A continuation upwards is most likely in my opinion.
There is some resistance ahead, and a retest after breakout from the wedgepattern will make me confident about another breakout.
My target is around 30NOK. If it will break down, there is a strong support around 14-10NOK
I belive this a stock with good potenitial for growth, now with the big renewable enegy plan that is on the way in the US.
This stock is clearly undervalued, and there is a strong posibillity that we will get positive news concering products for Semiconductors, batterys and solarpanels.
REC Silicon is one of the world's largest producers of polysilicon for the solar energy industry and silicon materials for the electronics industry.
The US has been too dependent on importing products overseas, and I belive there will be need too ramp up their domestic production capasity.
If it is possible, It would be my pleasure to hear Your thoughts about this matter..
Solyt


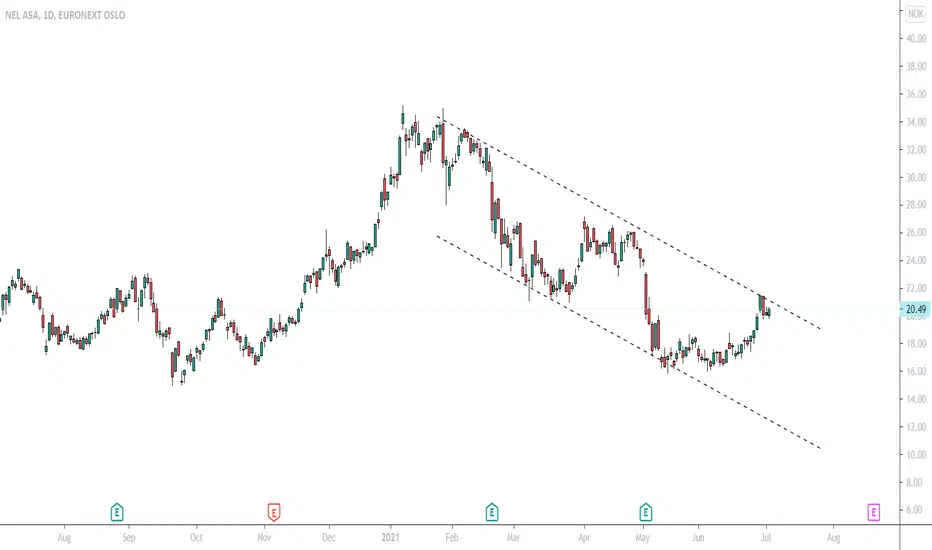
Has the green hydrogen bubble pop?As long as NEL trades above the 11.645 NOK (0.702 Fib retracement from the bottom of the impulsive waves), higher prices must be expected, and potentially another set of impulsive waves. The yellow box is the range from 0.382 to 0.618 of Fibonacci. This range is the classical value area for potential new trades during corrections. If NEL broke the support, prepare for substantially lower prices.
This is my proposed short-term labeling for the current correction.

Bearish divergence.Ill keep this one simple, bearish divergence on RSI and MACD as shown on chart.
Price goes up, indicators go down, simple.
Earnings today came in today, not as good as expected.
Volume is so low… someone buying small orders constantly pushing price higher. Short it is, but the market isnt having anything of it, yet…

Wedge patternWill there be a break out from this good looking wedge? Good risk reward on the upside?
@businessstart what do you think?

if you own cadeler AS: runif you own cadeler AS: run. They don't even deserve a capital letter on their name anymore.


Rana overview Rana reached it´s peak in May which was it´s all time high. Note that the stock was noted a couple of months ago which makes technical analysis less predictable. However marked psychology still remains the same as it has ever been, and the analysis is therefore based on the Elliott wave theory.
The stock made a impulsive move in the period between March and May, making the first wave of the Eliott wave theory. Then after the stock dropped to the 0.382 fib level (which tells us this was a deep correcting wave.) and then made a bounce off of this level. The stock price is now in the range of a triangle pattern and i am expecting bullish continuation, which would signify the start of elliott wave 3; which is the most impulsive wave.
The bollinger Band With (BBW) shows us that the bands are squeezing. With this we can expect that the price will move faster in the near future, wheter that is to the downside or upside. Combining this with the volume we can see that there has been an decrease in volume, as well as a decrease in price; which makes for a bullish volume profile.
This is my first public idea, would appreciate any feedback :)


ABCD Harmonic on AsetekAnalysis for ABCD forming on asetek, supported by fibonacci and volume levels. The thought is that this can develop into a butterfly harmonic

Bullish elliot wave count for SHLFElliot wave count suggesting Primary wave 5 for SHLF. All the relevant measurements are mentioned in the count
Take this with a pinch of salt since i am still learning elliot wave theory

Possible wave A in for Kahoot ASAProjection of possible primary wave B in wave 2 Cycle ABC correction for Kahoot ASA from support at bottom area of intermediate wave 2 from primary wave 5 extension.

Possible wave A in for Kahoot ASAElliot wave count when looking at an ABC correction forming on Kahoot ASA from a Cycle degree impulse wave with an extension in the Primary wave 5, finding support at the bottom of the extended Primary wave 5's Intermediate wave 2.

ELABS the Northern beast.This is a simple TA. U can see that its mooving out of the accumulation zone and have broken the first resistance.
Share your ideas.

BRG might breaktout. Going long.BORREGARD is slowly approaching the resistance line at NOK 191.2. The probability for a breakout is higher than for a pullback. This is a good situation to open a long position.


NOM in strong uptrend before final approvalNOM is close to starting the Engebø Rutile/Titanium mining operation and are only awaiting final checkoff from the authorities.
Price target 2021: 6-8 NOK
Price target 2022 (Q1-Q2): 12,5 NOK
Marketcap of approx 600 MNOK makes this a very attractive smallcap with great R/R.


NODL BullishNODL is looking bullish to me. It has broken out of the triangel and a "bullflag" I think it has the potential to go all the way to 30 kr in the near future. The resistant level it is at now will probably be broke soon, but first it might drop down to 15,80kr/16kr.