Finally time to re-test key resistance and ATH?Crayon is in general struggling with low-volume. However, end of day price action has been positive last weeks.
Convincing growth and strong market position leave no doubt that the fundamentals will deliver.
If able to keep above 50 MA with volume on Monday, should test TP1 and eventually TP2 during July.

Risky buyLet's see if it can break the purple line and find support on it, 60% gains possible then (Fat red resistance line). If it breaks the fat red line, who knows how high we can go.
If it bounces of the purple and find support on the blue one's 160-280 % gains. Just see where it finds support before buying.
I bought already on 0.28 NOK (bullish rsi on daily chart) watched it go down but decided to keep it.
I wouldn't throw too much money at it, but i also don't think it will go bankrupt.

NOD bullish or not?So despite of any bullish signals NOD might give I’m very careful simply because of this picture on the monthly.
Bearish rising wedge broken and now an attempt to retest.
On the latest sprint up, some gaps are left behind as well.
For this to become invalid for me, we need to build a solid support first, then we can find our way up again.
Let’s see how it works out!

YARA INTERNATIONAL (YAR)Hi,
Strong support 330 - 350.
Technical criteria:
1) The trendline since 2009
2) 2010 clean resistance matching perfectly with the trendline
3) Monthly EMA 100
Regards,
Vaido

EQUINOR (EQNR)Hi,
Strong support around 115 - 130.
Technical criteria:
1) Historically the third strong rejection from the round number 100
2) Rejection from the Fibonacci retracement level 62%
3) Historically strong support area
4) 50% drop from the recent top acting as a support
5) The trendline
Regards,
Vaido


BUY and BUY MORE if we cross the blue line BAKKAFROST Will continue to climb; If we cross the blue line, I ADvise you double your investment

I Recommend SELLING Then the blue line was broken with a large red candle; I advise you to sell and wait for a buy signal


Is ODL finding support?Quick one on my phone.
Potentially ODL is finding support here. Good entry would be if the black trendline gets broken.
Eyeing the gap at 12.54 and the next resistance around 14-15.

HUNTER arrived at major supportSame here, just like EURN and DHT, let's keep a close look at the behaviour here, as this could be support that reverses the trend.

BerGenBio trading plan for the next few daysThis is a trading plan based on price action. Keep in mind that BerGenBio will present updates on their current cancer treatment 25th june. This could boost the price extremely, because of the high volatility.
37.15 will be the safest price to enter a possible trade. That's why I am waiting for a pullback before entering.

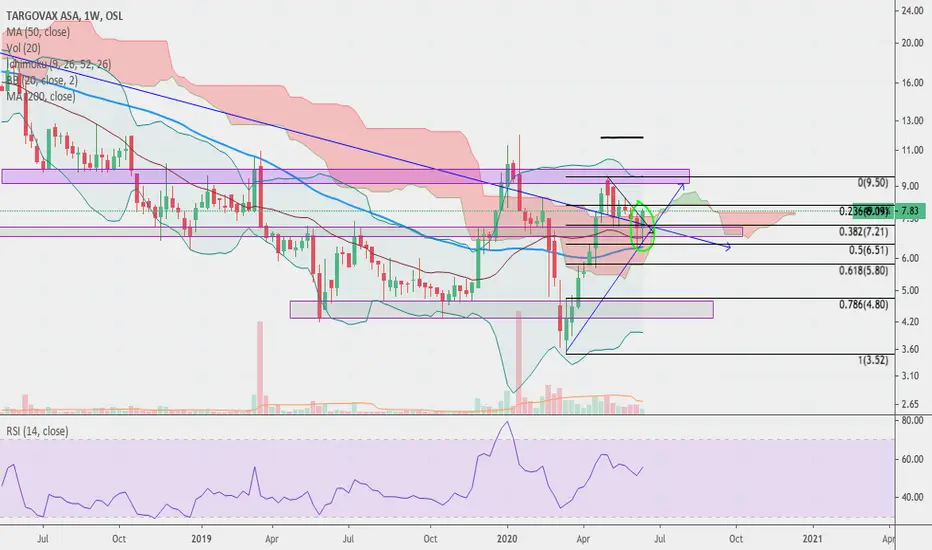
TRVX buy entryAs you know from my last analysis, TRVX gave a buy signal on the weekly chart last friday.
Now looking more closely for a good entry.
There is a smal gap down to 7.27, which I can easily see filled with a retest of the recently broken black trendline.
2 things will be providing support now, the horizontal support around NOK 6.75-7.20 and the blue upward trendline. I want to see the price hold and bounce from there and then it's a buy for me.
So to summarise:
- fill gap at 7.27
- finding support at the horizontal support area 6.75-7.20
- Not breaking the upward trendline.

Norwegian Air Shuttle reversalBullish montly divergence and price pretty low. Need a push from the news maybe.

TRVX buy signal, target 19Fundamental analysts give Targovax a big BUY, with a target of around NOK 19,-.
I've been waiting for a clear signal of support lately and it has just been formed.
IF the weekly candle closes more or less the way it is now, several positive buy signals are there:
- Long term blue downward trendline got broken and retested. Clear support found on retest.
- Horizontal support area of 6.8-7.15 (purple/gray) held and got a good bounce.
- Weekly cloud got tested and provided clear support. price above the cloud once again.
- Taking the fibonacci retrace of the most recent low and high, the 0.5 fib retrace marked the reversal point, furthermore supporting the idea that this was simply a retrace in a continuing uptrend.
- Bullish engulfing candle pattern generated on the weekly chart(provided price stays more or less like this).
- Short term counter trendline (black) got broken after finding support.
The only 2 cautions I currently have are:
- The relative low volume.
- We are still inside the daily cloud (only just). We clear this cloud at 7.93 (current level).
I Recommend SELLING The market will continue to decline during the rest of the days
Recommend selling

Consolidation before retest of resistanceCrayon is a cloud company with a significant position in the Nordic market and access to markets across the world.
There is substantial room for growth, both in their dominant Nordic area and other geographies.
They have just collected 30 MUSD targeted for M&A
I expect them to consolidate around the support zone for 7-14 days and start climbing towards a re-test of the resistance. Any news of completed and/or ongoing M&A is sure to boost the price significantly.
Medium term target 70
Long term target 85-90

Frontline finding support? Potential target of 100.Another interesting one. Fundamental analyses puts the target for this stock at around 98. So plenty of potential!
So FRO seems to have found support, for now.
Confluence of a horizontal longer term support and the bottom of the weekly cloud (@75.99 currently).
When does FRO become a buy for me?
- Has to break the blue trendline.
- Not break down out of the weekly cloud, so stay above 75.99.
Now looking at the target.
- The highest point of the weekly cloud is 96.50.
- The FA target is 98.
- There is a gap at 100.50.
So somewhere between 96.50 and 100.50 I would say.

SHLF reached my potential buying target, now what?SHLF made a huge plummet down after an equally impressive rise just before that.
Now, the gap at 3.70 has been filled and for now the trendline (blue) is holding. But it's not a buy signal yet. We need at least a confirmation in the candles and with the support structure before it becomes a buy.
- First start is there, the big wick on the current/last candle.
Now I want to see 2 things (maybe 3);
- Blue trendline holding
- getting above the support area (3.95)
(- retesting the support area (holding the trendline)
That's it!

TRVX buying opportunity, waiting for breakoutAnalysts, from a fundamental point of view, are giving TRVX huge potential with a target of around 19. Reason enough to look at the chart.
So TRVX still seems to find support around 7.00-7.40.
I'm looking for a reaction upwards at the top of the daily cloud and thus breaking out of the descending triangle that has been forming. This can happen any time now!
If this happens then it's a buy for me.


Largest owner in Photocure $PHO.OL offloading whole positionLargest owner in Photocure OSL:PHO apparently being forced to dump the whole position in the stock in the course of a few days, giving the stock extra momentum to the downside.
Updated list of shareholders show influx of US actors.
twitter.com
