Will TEL break the downward trend?A bit longer perspective. See clear downward trend with the current weekly view. Currently trading below both weekly and daily 50MA (W171.53, D156.55) and 200MA (W159.70, D170.85).
Broke previous support line on the 9th of March, bouncing back into the weekly trend (white lines). Will be looking for first checkpoint at break of daily resistance line at blue point. Will be interesting to see whether it can approach the daily resistance line from last top at the intersect with weekly resistance line in the longer time perspective. RSI chart good and high volume the last two-three weeks.
Currently no entry, but will be following this one. The long term support line from 2017 is set at 126.0. Will hopefully bounce back into better times as COVID-19 period is over.
Gladly looking for feedback as I am still learning.


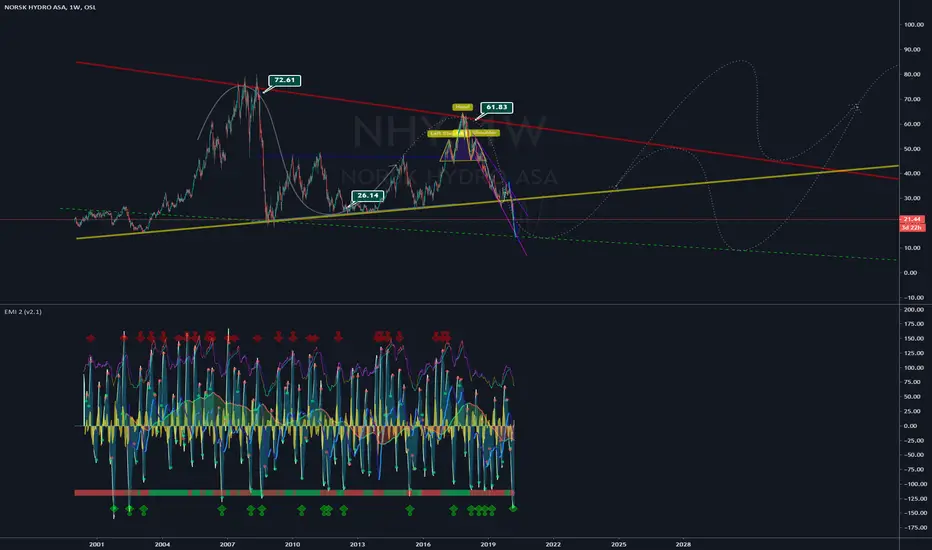
ASA - OSL Incepition day 23-3-2020Greetings fellow traders,
As time goes by, the markets evolve...
If your way of TA is strong, then the path will lead its way...
More visible, more probable:
Dashed lines; Possible forming patterns
Solid lines; Confirmed patterns / Support or Resistance
Dotted lines; Possible price-action trajectories / wave trend
Lighten colors = Support | Darken colors = Resistance
Current Pattern Formation Level:
Alpha pattern: Symmetrical Triangle -> Bullish Pennant
Beta pattern: Descending Broadening Wedge
Possible Echo Pattern: Descending Broadening Wedge
Today's Note:
Pretty much the same story as NAS. This one is a bit peculiar though. My point is, and it's a strange one. The price actually must come down a little bit, confirming a lower low. With result that this chart creates a bull pattern. Instead of a bearish one, if it does find support on the current region. Nonetheless, it does make sense? When you look at the big picture.
Genuinely curious whether this going to play out as I'm forecasting today.
To be concluded...
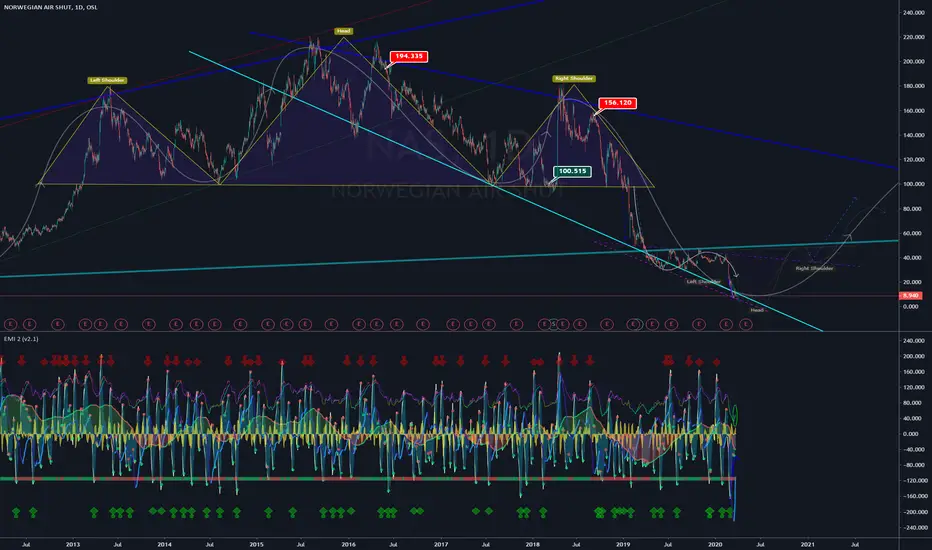
NAS-OSL Inception day 23-3-2020, Make it or break it.Greetings fellow traders,
As time goes by, the markets evolve...
If your way of TA is strong, then the path will lead its way...
More visible, more probable:
Dashed lines; Possible forming patterns
Solid lines; Confirmed patterns / Support or Resistance
Dotted lines; Possible price-action trajectories / wave trend
Lighten colors = Support | Darken colors = Resistance
Current Pattern Formation Level:
Alpha pattern: Symmetrical Triangle -> Bullish Pennant
Beta pattern: Descending Broadening Wedge
Possible Echo Pattern: Descending Broadening Wedge
Today's Note:
As requested and promised. My forecast on Norwegian Air shuttle. It's looking pretty bad. However when I use my style of TA on this chart and if this region is a bottom then this might rise again. Although this has to happen soon. Hopefully Europe comes to it senses also very soon. Nevertheless as you can see, you can trade with small risk. There is a chance you can loose money on this one of course. Not financial advice. But with just a small trade you can make a big profit, If this stock does recover! To be honest, that's a big if though.
Might be strange but EMI 2 is showing volume entering the space and showing more bullish signs. Definitely keeping an eye on this one.
To be concluded...
Mulig MOWI shortHar falt godt igjennom trend, og flere støttenivåer. For ikke å snakke om problemene som kommer når de ikke lengre får fraktet fisk, og etterspørselen synker pga korona


NAVAMEDIC (NAVA) | Perfect Technically but Fundamentally So-So!Hi,
Navamedic ASA, a MedTech and pharmaceutical company, in-licenses, buys and markets pharmaceuticals and other health care products in the Northern European region.
Considering technical viewpoints then Navamedic has started to approach a pretty strong support area, a lot of criteria make up a strong crossing area. To be honest, I don't know much about Navamedic fundamentals but I can say, if you see some perspective in the future then this would be your perfect spot to buy it if you don't see then SKIP IT!!
Technically a strong support area/buy-zone consists of:
1) A very strong resistance level becomes support. The price tried to break above the lower orange line 9(!) years and in the last year, it finally was successful. Now, this very strong resistance should act as a support level.
2) Inside the green buy-zone are also Monthly EMA50 and EMA100, plus Weekly EMA200 - all of them should act as support levels.
3) Fibonacci Golden ratio - Fibo retracement 62%
4) Navamedic becomes a member of a 50% club if the price reaches into the marked area.
5) Weekly timeframe AB=CD
6) Weekly timeframe channel projection
It should be a pretty good spot to gain short-term profits, a perfect area should stay between 11.00-12.50
As said, do your own fundamental research and if this matching with my technical analysis viewpoints then you are ready to go! If it doesn't match then...skip it!!
Regards,
Vaido

BORRBORR drilling.. Has only about 50 % debt to equity ratio as of 4Q19 and several of its rigs on contracts. Combine that with rebound in oil to take place into first part of 2021 and we have a good thing going.

XXL: Soon turn of trendBeaten to death, investors are throwing in towels one by one. The pain is soon ceasing.

GOGL // BIG FALL Golden Ocean Group has fallen a lot, although it has crossed several support lines, the stock has not received support. GOGL is now below the last support line, which could indicate that the share will continue to fall.
Overall, the stock is in a very bad trend. This indicates sales.
This analysis should not be seen as advice but for inspiration

Nordic Mining $NOM.OL is one to watch for 2020Nordic Mining prepares for lift-off
There hasn’t been a greenfield development of a mine in Norway for between 30 and 40 years but Nordic Mining is looking to change that via construction of its flagship Engebo rutile and garnet project.
www.mining-journal.com
Nordic Minining OSL:NOM just presented their Definitive Feasibility Study for the Nordic Rutile project at Engebø, Norway.
Once financing falls into place for this up and coming mining company, this stock should be a buy and own asset for the next decade.
Exercise extreme caution in the short term.
Engebø Rutile and Garnet
The realization of the Engebø project will establish Nordic Mining as a long term supplier of high grade rutile and garnet products.
www.nordicmining.com

Bullish Butterfly Setup Bullish Butterfly Setup on Norsk Hydro with a second retest of the potential reversal zone

TEL (Telenor) About to make new highsTEL (Telenor), Norway's biggest telecom company about to make a push to new highs.
On the 1H TEL just breached the level I wanted to see a small retracement from and is now finding support on it. We could either see a push up from where price is right now, or we could retrace down to the initial supply zone I had in mind.
Either way, I've still got resting orders in the 160.5 zone.
4H:

WATCH THIS QUICK UPPDATE!I do not have time to show all data today. Based on a combination of fundamental (no new data, less momentum, slightly more passive in media and news/ analytics telling small light investors/savers to take frofitt fast today or intra week) + tecnical analysis wich i will not describe more this time. i am now pre market 22.02.2020 going short in NEL. Lokking for that bounce at at least 100-150 MA, or look how it moves downwards at 200 SMA.
(I am long perspective long, but before tomorws session im taking profit and going short wich to mee makes verry much sense here in reegards of my investor strategy. Than you
Coment, lice and subscribe for further analysis!

Something exiting soon happening with BRILL The rig market still sour. Tecnical analysis might speak bearly more fore a bullis retrace/dragg uppwards, but taking in consideration the strong bearish market one should be verry carefull with setting ecact points for turns of dirrection. The drags down on all movements in this stock has had much greater time interval than uppwards. weeve seen short but strong uppwards movements. like one often see in strong bullish markets with reetracements down. I do not think the support at 32,5 will hold. The stock has just passed the low volume profile level wich we see every time this happens the stock getss renewed power downwards. The value distans and time distans are merely similar. So if history repeats it should get a good push down as a consequense of fassing the lowest level with low lever at volume profile.
I think the last turn on 67 level, wrepresents the historical point wich we will see a turn uppwards this time allso. This means we should be atient and look for the weekly rsi to lower a little further. Last time reaching 20. Then a push upp. I would will putt a long possition on this stock if we se continues down movement now, and we reach that 20 level. I do not belive we will se lower rsi levels now due to that the rsi levels historically just hav sunken above this level, when it has touched the botom of the big trend line, and at the same time hitting that low level volume profile level (wich we just passed and a long way to go down in that case). Furthermore the indication that wee se with the "mountain" pattern in the rsi chart, when we have now come down from a mountain topp and starting to see lower rsi levels, at the same time crossing those smaller trend lines look to me VERY similar to that last time at the 67 leve, if the rsi now is to go down to 20 levels.
Feel free to cometn what you guys think! i think we will see a prettiy good down movement now first. Lett the rsi hitt 20 before going long. Allways bee avare the possibility is much less for hitting right on a low for a long when youre in a downtrend...
Feel free to like coment and subscribe guys!


Photocure $PHO.OL trade above last major resistance on US patentPatent covering the use of Blue Light Cystoscopy (BLC®) with Hexvix as neoadjuvant* therapy in the treatment of bladder cancer in patients who are scheduled for a cystectomy.
Early stage study results have shown an antitumor effect and induced systemic immune effects of hexaminolevulinate (HAL) and blue light in an orthotopic model of rat bladder cancer. Photocure has the intention to further investigate Hexvix for its therapeutic effect and the patent is a result of Photocure’s continued focus on securing intellectual property rights for its research results and pipeline activities.
The patent was issued on 11 February 2020 and will expire in December 2036.
* Neoadjuvant therapy: treatment (such as chemotherapy) administered before primary cancer treatment (such as surgery) to enhance the outcome of primary treatment
Photocure OSL:PHO IR news release: photocure.com

EquinorNew energy, green, Cramer bearish on oil bla bla bla.
Oil is trending up and so will Equinor.

Vow/Scanship ASA hsfHodeskulder-formasjon utløst ved 32.20, potensiale ned til gul linje på 26 kr. Dette er også bunnen av trendkanalen, så et svært sannsynlig scenario.

Can tecnical pattern push the stock back even with bad sentimentTO ME technically there is a lot off positive long term signs here. My challenge will be WHEN, at what price exactly to enter long. What do you guys think? should i enter at 26 and say good is good? or do you guys think i should try to hitt at a lower level? whe have seen eraligher that the right shoulder might be a little lower, but weeve allso seen it higher for this stock. And what do you think if one buys at 26 and it crosses down throught 25. Is that a sign for a quick temporary sell? Tell me in the coment section bellow!
Fundamental analysis will probably play a big role annyhow. This is not a complete analysis. BUT the technical patterns are verry bright clare to the eye. The stock tends to never trend below theese levels we are now closing in at, at 26-24. Ive waitet since about november to see the stock at theese levels and im now getting verry happy that the stock is moving exactly following the pattern i drew upp in november. With head and choulders on the 4h and day chart.
The tecnical aspects that counts for a medium time frame rend uppwards is:
- first of all the history repeating itself with the head and sholders.
- History repeating itself with head en shoulders - at theese same VERRY STRONG support levels at 25-26 (Look at volume profile also).
- RSI bellow critical lavels with the first shoulder in the pattern. Here annyway, i am not shure if we now will se a crossing of critical levels again. My thought for now ist that i will not put to much weight om the RSI pussition between now-and possibly lower levels. It is low allready, so if we would see 26 price levels with the non-crossing RSI i would personally still see it as a cualified time to buy. Mabye look intraday to se if i can hit som lower level spike down under 26..
- Last B was 15 feb 2016, before that 07 may 2012, before that 02 may 2009. SO.. in thought of the time we see some pattern here. now its 10 feb 2020. So we would look to buy in the time between now and end of may, 4 years after last price at theese levels.
Against:
- One should not underestimate the possibility of in mowing down the support at 25, with allso day bars or intraday bars spiking well below these lewels down to for example 22,5. Around time for by i would follow news that might come out that can push it further down than the 25 levels. If i have bought at 26, and it pushes down to 25 i will sitt. Crossing down at 25 i will probably sell and wait for clearer signs of my tecnical (positive) factors to show themselves. Allso see some positive days with increasing wolume to get confirmation that we ar not going away from the historical trend or setteling bellow the heavy supports down there.
TO ME technically there is a lot off positive long term signs here. My challenge will be WHEN, at what price exactly to enter long. What do you guys think? should i enter at 26 and say good is good? or do you guys think i should try to hitt at a lower level? whe have seen eraligher that the right shoulder might be a little lower, but weeve allso seen it higher for this stock. And what do you think if one buys at 26 and it crosses down throught 25. Is that a sign for a quick temporary sell? Tell me in the coment section bellow!

Yara International (YAR) | Looks Promising!Hi,
Yara International ASA is a Norwegian chemical company. Its largest business area is the production of nitrogen fertilizer, however, it also encompasses the production of nitrates, ammonia, urea and other nitrogen-based chemicals.
Some fundamental pros & cons:
+ Under the fair value.
+ A lot of insiders buying.
+ Yara and IBM launch an open collaboration for farm and field data to advance sustainable food production.
- A bit high debt.
Technical criteria:
1. The trendline third touch should act as support.
2. A strong orange horizontal price zone is printed several yearly highs and lows.
3. Fibonacci Retracement 62% acting as a support level.
4. Monthly EMA100 acting as support.
Technically, I can see that the long-term growing platform is pretty solid, it stays between 317-340. Do your own research about fundamentals, company potential, valuation numbers and etc.
Do not forget that perfect investing consists of good fundamentals (you have to make your own research) and you need a good buying area (you have it)!
Line chart:
Regards,
Vaido

Can we brake through?270-275 has been a turning point for ABP, could we break through here with rising oil prices?

Waiting for a new buy posLooking for a new buy position.
In Marts 2018 Frontline hit an all time low and after that a new uptrend have started.
Atm its on its way down after a 101 % gain in the last 4 month ( Sep okt nov dec )
the normal drop with Frontline since the uptrend , is 70-110 % gain following a drop of 25-40 % and as of today it have dropped +/- 27 %
so im thinking it gonna drop some more and maybe even alittel more then it use to becouse as you all know we have a virus fra china going on and that have a impact on almost all stocks, so we have to keep that in mind aswell befor making a buy or thinking omg its down 42 insted of the normal MAX 40 %
as you see , the RSI and the MACD is not bullish but bearish ( so its NOT a buy atm )
as you also can see, we have higher highs and lower lows and its holing that patterns pretty nicely!
As of now , im only making this cart to keep up with my already investet stock in Frontline and gonna jump in again when i see a turning point.
Fell free to comment - we all are here with diff idears and mind set
Disclaimer : i have this stock and im long and waiting for a new buy position.
