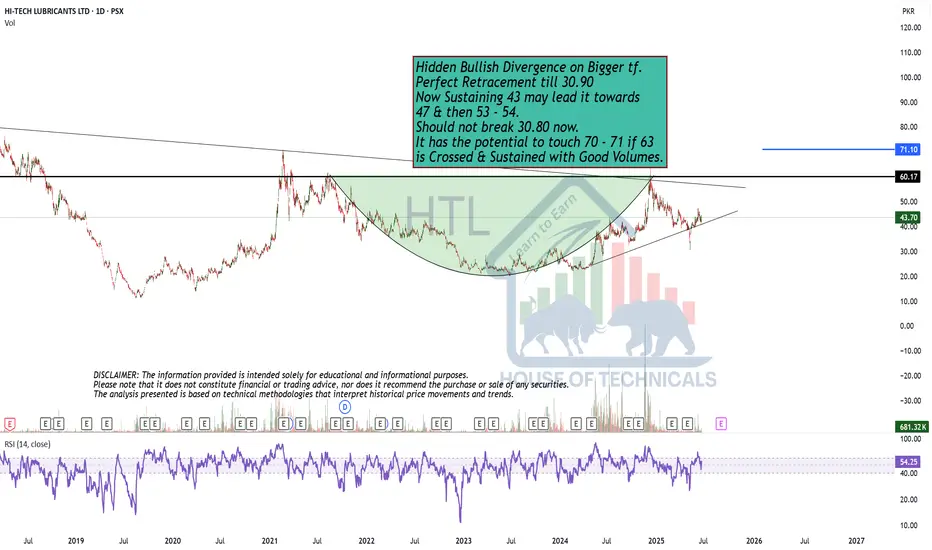
Perfect Retracement till 30.90Hidden Bullish Divergence on Bigger tf.
Perfect Retracement till 30.90
Now Sustaining 43 may lead it towards
47 & then 53 - 54.
Should not break 30.80 now.
It has the potential to touch 70 - 71 if 63
is Crossed & Sustained with Good Volumes.
GTYR | Inverse Head & Shoulder PatternGTYR on the daily timeframe shows a classic Inverse Head and Shoulders pattern forming, indicating a potential bullish reversal. The pattern is well-defined with the left shoulder, head, and right shoulder, and price is currently testing the neckline resistance around PKR 41. A successful breakout

SAZEW (PSX) – Weekly Time Frame Technical AnalysisThe chart represents a Fibonacci retracement-based setup for a potential bullish continuation, provided key levels are respected.
Current Price: PKR 1,094.77
The price is hovering between the critical Fibonacci levels of 0.618 (PKR 1,178.21) and 0.786 (PKR 1,138.38).
If the stock closes two conse

Sazew key levelsKey levels are
1404
1271
1198
1056
1002
931
Note: This is not a buy/sell trade call.

OGDC PROBABLY IN WAVE ' B ' OR ' 5 ' - LONGOGDC is most probably in wave B or 5
Currently the price is forming a flag pattern as minor wave b or 2 which might continue to build this week. As per our preferred wave count we are only looking to buy OGDC once it breaks above the flag formation.
Last minor swing high is at 213.50 at the moment

DAAG LONG TRADE 16-06-2025DAAG Long Trade
Rationale : DAAG has been in a bearish channel (bull flag) since Dec 2024. Recently, the stock trended at the upper level of the channel, absorbing overhead supply. Today, it broke out of the channel with a huge volume metric imbalance and gradient, taking price above the axis line.

BBFL is BullishPrice was in a strong downtrend, however an extended bullish divergence, breakout from descending trendline, printing of hammer candle and a higher high all hint at the return of bulls for the price action. If freshly printed higher high is broken with good volume then we can expect a good bullish

TRG LongTRG has made a perfect bullish harmonic pattern where it has retraced to exact 127.2% of its last top and now will move till 161.8% of its all-time high which is nearly 295. This is not a buy/sell call, its just my own analysis and you may disagree. However, I'd urge you to study bullish and bearish

See all popular ideas
Community trends
Stock collections
All stocksTop gainersBiggest losersLarge-capSmall-capLargest employersHigh-dividendHighest net incomeHighest cashHighest profit per employeeHighest revenue per employeeMost activeUnusual volumeMost volatileHigh betaBest performingHighest revenueMost expensivePenny stocksOverboughtOversoldAll-time highAll-time low52-week high52-week lowSee all
No scheduled reports
Sector 10 matches | Today | 1 week | 1 month | 6 months | Year to date | 1 year | 5 years | 10 years |
|---|---|---|---|---|---|---|---|---|
| Finance | ||||||||
| Energy Minerals | ||||||||
| Process Industries | ||||||||
| Consumer Non-Durables | ||||||||
| Non-Energy Minerals | ||||||||
| Utilities | ||||||||
| Health Technology | ||||||||
| Consumer Durables | ||||||||
| Producer Manufacturing | ||||||||
| Technology Services |