Wait for a Proper Support!Wait for some Bullish Candles to appear at Support level with Good Volumes.

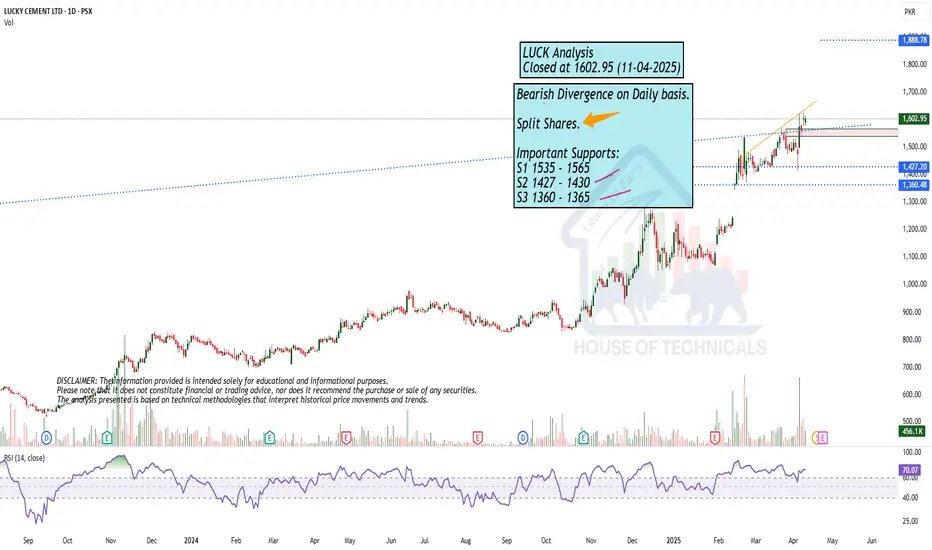
Impact of Split sharesBearish Divergence on Daily basis.
Split Shares.
Important Supports:
S1 1535 - 1565
S2 1427 - 1430
S3 1360 - 1365
Wait for a Bullish Sign!Important Support Zone
166 - 184
Somewhat Bullish on Monthly TF,
But if 180 breaks,we may witness
further selling pressure.

SAZEW Bull Flag Pattern Target Idea.SAZEW Uptrend starts on 28 Jan 2025 and in 14 working days go maximum. Then start downword and move up and down in a range that range BO at 1087 rate and current rate is 1141.
Flage Pole price change is 244 which was added to BO price giving target of 1320 (100%), Half of Target at 50% would be 1207 that expected to be achieved on 16 April 2025, where Final Target have to be achieved hypothetically around 21 April 2025
This is Daily Chart working and everyone have to do his own working for trade of buy or sell.
This is not for trade purpose but only for educational purpose

SSGC-PSX, A Good Probability Buy TradeConfluences include:
1. Support of Anchored VWAP
2. EMAs Channel
3. TL Breakout with sustained volume AFTER Breakout
4. Tendency of Price to test ATH level with a good momentum.

BBFL- 2x Buying Opportunity!If price breaks above TL with good volume, but trade is on the cards with 2x earning potential

GGL Likely to Touch PKR 20.62 SoonGhani Global Holdings Limited (PSX: GGL) is displaying strong bullish signals, with rising volume and a steady uptrend pushing the price closer to key resistance levels. The stock recently rebounded from support around PKR 12.00 and has been forming higher lows on the daily chart — a classic bullish structure.
Momentum indicators like RSI remain in healthy territory, and a breakout above PKR 16.96 (the 52-week high) could trigger a rally toward PKR 20.62. With improving investor sentiment and positive fundamentals, GGL looks poised to test this level in the short to medium term.
This is not buy or sell call do your own research.

Haleon Stock Trading Strategy:Haleon Buy Strategy:
Buy around 852-800
Stop Loss: 760
Targets:
1. 900
2. 954
Plan:
1. price when come to down then buy. don't buy on high level.
2. Buy when price reaches 852-800.
3. Set stop loss at 760.
4. Aim for targets.
Reminder:
Set position size according to risk tolerance.

HCAR Stock Buying Strategy HCAR Buying Opportunity:
Key Levels:
1. Current price: 314
2. Buy zone: Below 300
3. Stop loss: 282
4. Targets: 324, 338, and final target 348
Strategy:
1. Buy on weakness: Enter the trade if the price dips below 300.
2. Risk management: Set a stop loss at 282.
3. Profit targets: Aim for 324, 338, and 348.
Considerations:
1. Market conditions: Monitor market trends and news.
2. Risk tolerance: Adjust position size according to risk appetite.
This strategy is based on the provided information. Always conduct your own research and consider consulting a financial advisor before making investment decisions.

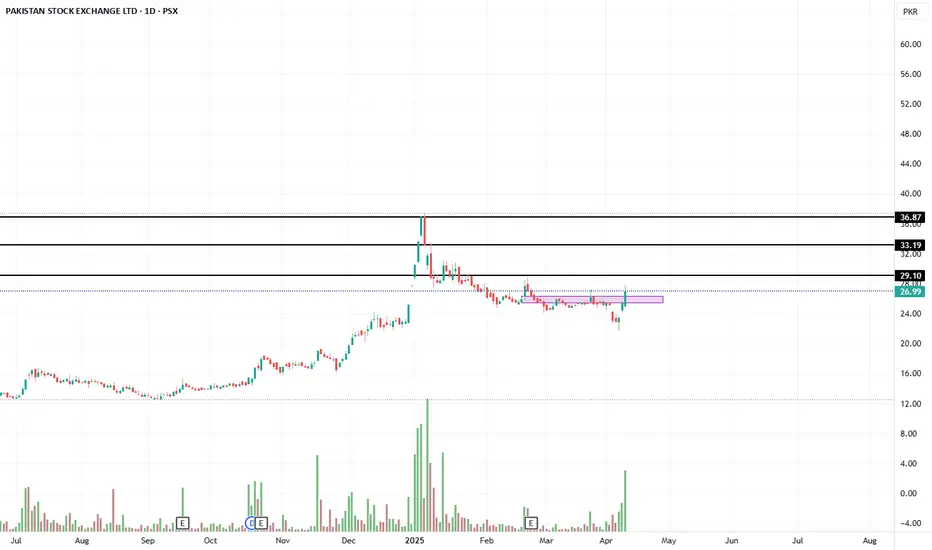
PSX Stock Trading StrategyPSX Buying Opportunity:
Key Levels:
1. Current price: 26
2. Buy zone: 24-22
3. Stop loss: 21.30
4. Targets: 29, 31, 34, and final target 36
Strategy:
1. Buy on weakness: Enter the trade if the price dips to 24-22.
2. Risk management: Set a stop loss at 21.30.
3. Profit targets: Aim for 29, 31, 34, and 36.
Considerations:
1. Market conditions: Monitor PSX trends and news.
2. Risk tolerance: Adjust position size according to risk appetite.
This strategy is based on the provided information. Always conduct your own research and consider consulting a financial advisor before making investment decisions.
Glaxo Stock Trading StrategyGlaxo is in an uptrend. A buying opportunity arises if the stock weakens to 430-420, with:
Key Levels:
1. *Buy zone*: 430-420
2. *Stop loss*: 410
3. *Target 1*: 460
4. *Final target*: 485
Strategy:
1. *Buy on weakness*: Enter the trade if the stock price dips to 430-420.
2. *Risk management*: Set a stop loss at 410 to limit potential losses.
3. *Profit targets*: Aim for 460 and 485.
Considerations:
1. *Market conditions*: Monitor overall market trends and news.

#ACPL is above green sky (strong bullish zone)#Acpl is now above green sky (Strong bullish zone). It is expected to cross 280 and 320 level.
Note: This is not a buy or sell call, trade at your own will. Use stop loss as per your strategy.

Psx (stock) is above green sky (strong bullish zone)Psx is now above green sky (Strong bullish zone). It is expected to cross 30 and 40 level.
Note: This is not a buy or sell call, trade at your own will. Use stop loss as per your strategy.

#Pael is above green sky (strong bullish zone)Hcar is now above green sky (Strong bullish zone). It is expected to cross 50 and 60 level.
Note: This is not a buy or sell call, trade at your own will. Use stop loss as per your strategy.

#Ssgc is above green sky (strong bullish zone)#Ssgc is now above green sky (Strong bullish zone). It is expected to cross 45 and 60 level.
Note: This is not a buy or sell call, trade at your own will. Use stop loss as per your strategy.

#CPHL is above green sky (strong bullish zone )#CPHL is now above green sky (Strong bullish zone). It is expected to cross 110 and 130 level.
Note: This is not a buy or sell call, trade at your own will. Use stop loss as per your strategy.

Glaxo is above green sky (strong bullish zone)Glaxo is now above green sky (Strong bullish zone). It is expected to cross 500 and 600 level.
Note: This is not a buy or sell call, trade at your own will. Use stop loss as per your strategy.

Hcar is above green clouds (Strong bullish zone)Hcar is now above green sky (Strong bullish zone). It is expected to cross 350 and 400 level.
Note: This is not a buy or sell call, trade at your own will. Use stop loss as per your strategy.

PSX – 30-Min Short Trade Setup!📉 🔻
🔹 Asset: Pakistan Stock Exchange Ltd. (PSX – PSX)
🔹 Timeframe: 30-Min Chart
🔹 Setup Type: Double Top + Rising Wedge Breakdown
📊 Trade Plan – Short Position
✅ Entry Zone: ~27.00 (Rejection near resistance trendline)
✅ Stop-Loss (SL): 27.67 (Breakout high + wedge invalidation)
🎯 Take Profit Targets:
📌 TP1: 25.98 – Previous breakout level
📌 TP2: 25.03 – Horizontal support
📌 TP3: 23.60 – Trendline base
📐 Risk-Reward Calculation
🟥 Risk: ~0.67/share
🟩 Reward to TP3: ~3.40/share
📊 R/R Ratio: ~1 : 5+ – High-efficiency pullback play
🔍 Technical Highlights
📌 Double top rejection at supply zone ✔
📌 Rising wedge breakdown with selling pressure ✔
📌 Bearish engulfing near resistance ✔
📌 Volume spike confirms reversal intent
📉 Risk Management Strategy
🔁 Move SL to breakeven after TP1
💰 Lock profits at TP2
🚀 Let remainder trail to TP3
⚠️ Setup Invalidation If:
❌ Price breaks and closes above 27.67
❌ Bullish consolidation instead of pullback
❌ Breakout volume resumes
🚨 Final Thoughts
✔ Bearish structure with strong reward potential
✔ Clean rejection at multi-day resistance
✔ Ideal short setup post breakout exhaustion
🔗 #PSX #ShortSetup #ProfittoPath #ChartAnalysis #BearishReversal #SwingTrade #TechnicalSetup #PriceAction #RiskReward #SmartMoneyMoves

Glaxco Stock Buying OpportunityGlaxco is in an uptrend. A buying opportunity arises if the stock weakens to 430-420, with:
Key Levels:
1. *Buy zone*: 430-420
2. *Stop loss*: 410
3. *Target 1*: 460
4. *Final target*: 485
Strategy:
1. *Buy on weakness*: Enter the trade if the stock price dips to 430-420.
2. *Risk management*: Set a stop loss at 410 to limit potential losses.
3. *Profit targets*: Aim for 460 and 485.
Considerations:
1. *Market conditions*: Monitor overall market trends and news.

Glaxco Stock Buying Opportunity:Glaxco is in an uptrend. A buying opportunity arises if the stock weakens to 430-420, with:
Key Levels:
1. *Buy zone*: 430-420
2. *Stop loss*: 410
3. *Target 1*: 460
4. *Final target*: 485
Strategy:
1. *Buy on weakness*: Enter the trade if the stock price dips to 430-420.
2. *Risk management*: Set a stop loss at 410 to limit potential losses.
3. *Profit targets*: Aim for 460 and 485.
Considerations:
1. *Market conditions*: Monitor overall market trends and news.

Closing just below Weekly Resistance.Closing just below Weekly Resistance.
If 36.90 is Broken, we may witness further
Selling pressure.
Sustaining 36 - 37 would again take the
price towards 49 - 52. However, Weekly
Resistances are there like 43 - 44 & then
48 - 49.

96 - 97 is the Immediate Resistance.96 - 97 is the Immediate Resistance.
Crossing 101 will make it further Bullish.
In extreme cases:
Support Zone is 88 - 92
Resistance Zone is 106 - 112
