
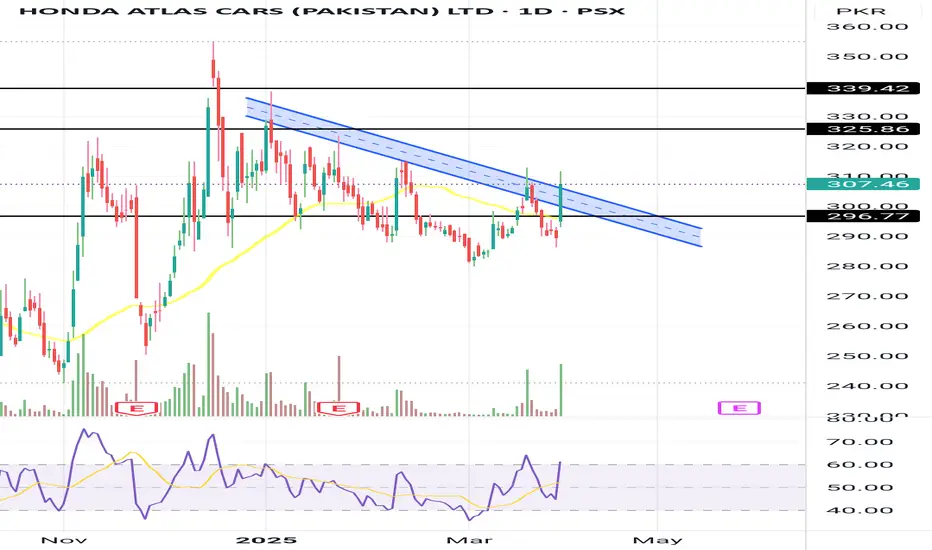
HCAR - BUYING OPPORTUNITY Buying Opportunity - HCAR
Buy Range: 297-307 (buying on weakness)
Stop Loss: 294
Target 1: 325
Target 2: 339
Further Action:
Hold if the stock sustains above 340.
Buying Opportunity - SSGCSSGC give a buying opportunity for LONG.
buying range 39-37
Stop Loss - 36
Target 1: 44
final target 50

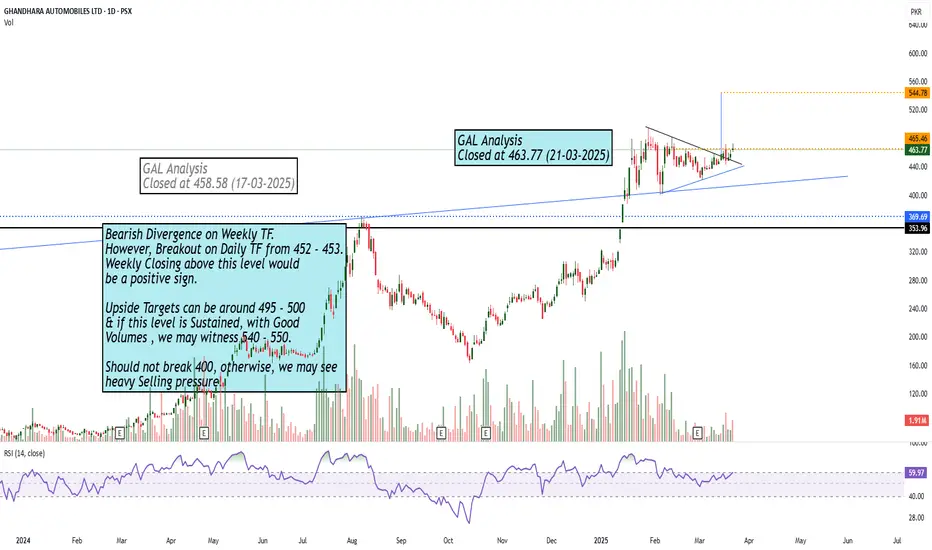
Bearish Divergence on Weekly TF but..Bearish Divergence on Weekly TF.
However, Breakout on Daily TF from 452 - 453.
Weekly Closing above this level would
be a positive sign.
Upside Targets can be around 495 - 500
& if this level is Sustained, with Good
Volumes , we may witness 540 - 550.
Should not break 400, otherwise, we may see
heavy Selling pressure.
Buy Idea: Habib Bank Limited (HBL)📘 Buy Idea: Habib Bank Limited (HBL)
🔹 Timeframe: Monthly | Strategy: Structure + Type 1.4 + Context Targets
✅ Entry Zone:
Buy between 145 – 155 PKR (near the marked "M Type 1.4" level).
📉 Stop Loss (SL):
Below 92 PKR
("This low to be held as protected low" – the ITL zone).
🎯 Take-Profit Targets (TP):
Target Price (PKR) Gain % Description
TP1 240 ~60% First context target
TP2 314 ~120% Previous major high
TP3 411 ~165% Final potential rocket move 🚀
📌 Context & Narrative:
Price broke key structure levels and is forming a bullish base.
Multiple STL levels swept – shows smart money accumulation.
"M Type 1.4" indicates institutional interest.
Targets are based on historical price action and FVG-based projection.
💡 Position Strategy:
Buy 50% at current price (150–155)
Add 25% on a pullback to 140
Add 25% if price dips toward 130

PRL is gaining momentum for upside movePRL is rising on daily time frame, price is printing higher highs and higher lows
good chance for buying at current level with a define stop loss

Bullish on All Time Frames.Bullish on All Time Frames.
Monthly Closing above 211 - 212 would
be very positive for OGDC.
Retested the Previous Breakout Level
around 194 - 195.
Hidden Bullish Divergence on Daily Tf.
227 - 228 is the Weekly Resistance that
seems to break this time.
If this level is Sustained, we may witness
250+ initially.

FCEPL*The price action is forming an ascending triangle, which is generally a bullish continuation pattern.
*The RSI at the bottom shows market momentum and potential overbought/oversold conditions.
*Bullish Strategy: Buy after a breakout above 93 , with targets at 111 and 117.
*Bearish Scenario: If the price fails to break out and falls below 75
it could invalidate the bullish pattern, leading to further downside.

MTL*Head & Shoulders Pattern: A potential head and shoulders pattern is visible, which is a bearish reversal structure
but still no any negative sign RSI moving in range between 30-70
*Safe Buying Zone: Marked around 615-620 , indicating a breakout level where price stability could confirm an upward move.
*Bullish Approach: Buy if price sustains above 615-620 with targets toward 640 and 680
*Bearish Approach: If the price breaks below 474.73 , it could confirm the head and shoulders breakdown, leading to a further drop.

PSO - LongSimply based on such a long consolidation of 10 years, this stock has huge potential.
If you are a value investor and looking for great returns, then this share is for you with the target of Rs 650.
Short term target for traders is Rs 500-525


ISLCurrent Price: The stock is currently trading at 78.06
Safe Entry Point: A safe entry for a swing trade is suggested after 89-90
*Head and Shoulders Pattern:
If the price breaks below the current level and fails to show strength, it could drop further toward the Head & Shoulders target of 60.85
A downward movement (red arrow) represents this bearish scenario.
*Bullish Scenario:
If the stock shows positive signs (such as increased volume, breakout confirmation), it could bounce back up.
A breakout above 89-90 could push the price towards 101.21


Bullish on Monthly TF.Bullish on Monthly TF.
Though HL Confirmed on Bigger TF but Important
to Cross & Sustain 730 & if this level is Crossed with
Good Volumes, we may witness 770 - 775 initially.
On the flip side, 640 - 645 may act as Immediate
Support.
It should not break 608, otherwise we may witness
more Selling Pressure towards 550 - 570.

No Bearish Divergence Yet!Bullish on Monthly TF.
Though HL Confirmed on Bigger TF but Important
to Cross & Sustain 730 & if this level is Crossed with
Good Volumes, we may witness 770 - 775 initially.
On the flip side, 640 - 645 may act as Immediate
Support.
It should not break 608, otherwise we may witness
more Selling Pressure towards 550 - 570.

Play On LevelsRetested the Breakout Level around 180 - 185 &
Closed just above a Very Important fib level around
188.
But, 188 - 195 is Very Important Resistance as of now.
If 195 is Crossed with Good Volumes, 212 - 215 can be
touched initially.
Couple of Positive Weekly Candles with comparatively good
volumes may confirm HL on Monthly basis.
On the flip side, 175 - 184 is a Support Zone & also Double
Bottom around 175 - 176, so Short Term Traders may
expect a bounce from this level.

SSGCA rising wedge or ascending channel is forming.
A descending channel target is marked at 25.80 PKR in case of a breakdown.
Key Price Levels & Trade Strategy:
Safe Buying Zone: Above 39 PKR if sustained.
Take Profit (TP) Levels:
First TP: 44.40 PKR
Second TP: 48.25 PKR
Long-term TP: 50 PKR (if a bullish divergence forms and price breaks upward).
Relative Strength Index (RSI): Displayed below the price chart.
RSI appears to be declining after a peak, which could indicate a potential pullback or consolidation.
Interpretation:
Bullish Scenario: If the stock sustains above 39 PKR, it could rally toward 44.40 PKR and 48.25
Bearish Scenario: If it fails to sustain and breaks below support, it could drop towards 25.80

Buy HCARHCAR after completing its Elliott Wave cycle in December 2023 has gone into complex correction. First phase of correction completed with type ABC Irregular Failure following all rules both price and time-wise. Now it is forming its second phase of correction with contracting triangle. It has fulfilled its criteria for formation of e-wave. It can start its trending move any time at the levels 289-278. However, there are also chances that e-wave may go further into formation of another small triangle. In that case, this small triangle will be formed without affecting price level to the down-side. It is matter of time only that HCAR may start its upward move towards 417. BUY @ cmp is recommended.

HIN00NThe chart indicates a bullish sentiment, but confirmation is needed with a breakout above 945.
If the price holds above this level, it could move toward the 985 PKR target.

ABOTBullish Divergence:
The Relative Strength Index (RSI) at the bottom of the chart shows bullish divergence
This indicates potential upward momentum or trend reversal.
Safe Buying Zone:
The analyst suggests that buying is relatively safer near the lower boundary of the channel, where support has been confirmed.
Target Price (TP 11250):
The expected price movement is shown with an arrow, indicating a potential upward move towards the target price of 1,250 PKR.


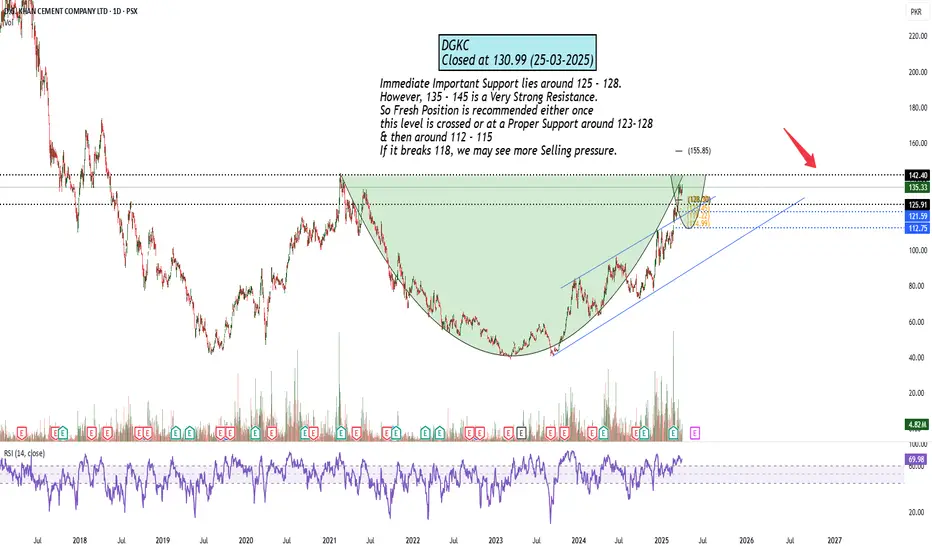
135 - 145 Important Resistance ZoneImmediate Important Support lies around 125 - 128.
However, 135 - 145 is a Very Strong Resistance.
So Fresh Position is recommended either once
this level is crossed or at a Proper Support around 123-128
& then around 112 - 115
If it breaks 118, we may see more Selling pressure.
MLCF AS PLANNEDMLCF respected all the level and did exactly as marked. I was just going through my previous analysis and just looked at this amazing chart. thought to share with you! look at the patterns and the perfect breakout retest strategy I mostly play with.
