POWER CEMENT PSX LONGPower Cement Long RR 1:3 PSX in Bull Run Idea based on sentiment analysisLongby xainalich4
OGDC drop down and bounce back levelsThese are #OGDC drop down and bounce back levels. Note: Trade at your own risk.by W_0300_82082103
TRG, Bearish Trend ContinuationBearish Trend Trendline Resistance No indication of Bullish momentum Short sell Entry 1 @ CMP Entry 2 @ trendline retest SL 61.5 Target 44-45Shortby itsrohansaeed1
Airlink Buying and Selling ZoneThese are buying and selling zones of Airlink Note: Trade at your own risk. Longby W_0300_82082103
FCCL is in correction and favourable for buyFCCL is in correction phase and buy on these levels and sell on above 36 level. Note: This is not a buy/sell call. Trade at your own risk. Longby W_0300_82082108
TRG is ready to flyTrg is near its strong resistance og 52.6, after crossing it Next level will be 61.4 and Next level will be 74.77 Note: This is not a buy/sell callLongby W_0300_82082105
Bearish Divergence on PSOA bearish divergence is appearing on the PSO Daily time frame which is indicating a price correctionShortby GulKiyani0
RPL-LONGRPL is trading in a bullish trend and now retraces from 0.786 fib ratio and 200 MA,so we will take a long trade hereLongby shanihamza5
PPL is in uptrend PPL is bullish,price has taken a correction and current levels are attractive for buying .Longby kashif19993
Power cement is flying to 11.5 level after flying over 8 levelPower cement monthly chart is showing these 2 important levels, It can go to 11.5 after crossing level of 8Longby W_0300_82082103
Flying cement is crossing 8 level, Going to 11Flying cement is crossing 8 level mar and its next level will be near 12 Longby W_0300_82082102
CPHL continuing upward moveCPHL was in correction phase know showing bullish signs on daily char, current levels are good for buying .Longby kashif1999116
OBOYWe can attempt to buy OBOY from specified levels as it give breakout of trendline resistance , accumulation phase , also there is no bearish divergence at current levels. SL , TP mention in chart.Longby SignalEdgeUpdated 3
EPCL - Long EPCL has given a breakout of a very strong trendline and there is a bullish divergence adding confluence of a trend reversal. Hence, going long on EPCL in PSX.Longby mustafabaig993
SSGC is ready to flySSGC is breaking level in monthly chart and its key level is 16.5, After breaking this level it will go to 22 level. Longby W_0300_82082102
KOHC potential Buy setupHere are the recommended trading levels: Buy 1(CMP): 366.9 Buy 2: 334 Stop Loss Level: Closing below 277 Take Profit Level 1: 423.63 Take Profit Level 2: Open Reasons for bullish bias: - Fundamentally a very strong company - Price is at a good fib zone - Overall a bullish trend - Price synched with RSILongby TradeWithParasUpdated 3
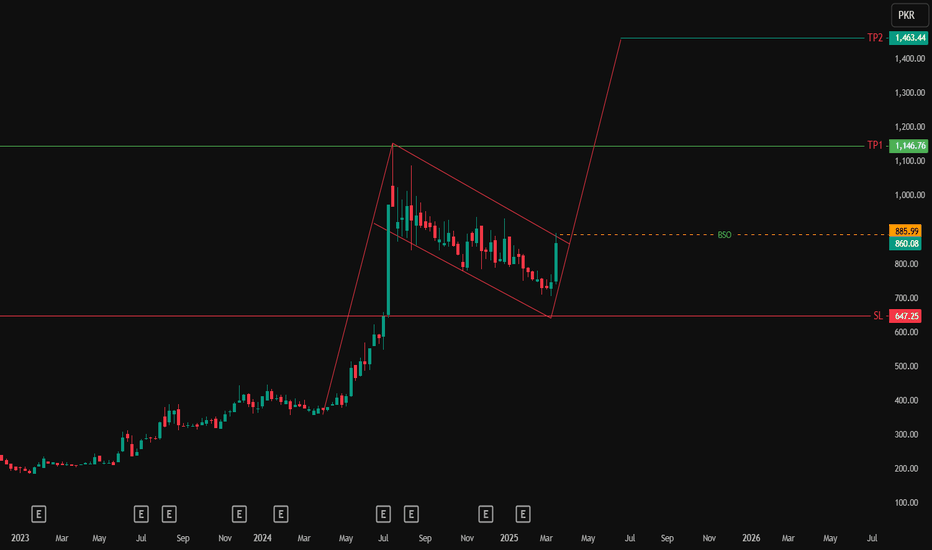
Systems Buy Idea!Systems has been accumulating for exactly the same time now as last time if it breaks above 600-700 could be the final targetby TradeMarketWatchUpdated 9
BWHLIn financial markets, "AB=CD" is a harmonic pattern that traders use to predict potential reversals or continuations in price movements. It's named after its basic structure: the price forms two legs (AB and CD) that are equal in time and price magnitude. A "bullish AB=CD" pattern suggests that the price is likely to rise. Traders look for specific Fibonacci ratios between the lengths of AB and CD, typically 0.618 or 1.618, to confirm the pattern. When these ratios align, it's seen as a signal that the price may continue to rise after completing the CD leg. However, like any technical analysis tool, it's not foolproof, and traders often use it in conjunction with other indicators and analysis methods to make informed decisions.Longby B9A-88652-NisarAhmad0
FCCL is heading to 60 level FCCL financial results was good and today reduction of 250 bps in monetary policy is additional helping hand to push FCCL share price to 60 level, Today is breaks 35 level and now it is going to break these next levels in chart soon. Note: This is not a buy/sell call. Longby W_0300_82082103
NETSOLPulled back from 200-day SMA, targets and entry points are mentioned on the chart.Longby mbaberhanif6
MLCFThe price action is in uptrend, currently trend line resistance lies around 40 which consider as the first target of MLCF. For swing trading setup, price needs to break out for upside projection. Longby mbaberhanifUpdated 7
MLCF | Flag PatternMLCF is making flag pattern, break out is already observed, flag projection lies around 48Longby mbaberhanif4
SYS | Parallel Channel VS Support LevelThere are two possible scenarios in SYS technical chart, either it follows parallel channel or pull back from its current support level.by mbaberhanifUpdated 116