ABOT longCurrently at a very good level.
Broke its all-time high and then came back to retest.
Golden cross about to happen on monthly TF.
Mov Avg 10 is also near, can come back to retest before jumping again but it can / cannot be the case always.
Next targets can be 1690 or 1700. Better to get out at 1650 at a safe side.
Some big candles at daily TF also suggest that player has positioned itself for long flight.
INDU longRecently broke its all time high and came back to retest it.
Currently at a very good level and can touch its next targets which are 3,000 and 3,270.
It can be a little bit delayed as golden cross on monthly time frame is a bit far and moving avg 10 is also far from its current price. It MAY retrace back to touch its moving avg 10 before going back to its all-time high levels.
Low volumes also suggest that it is currently in accumulation phase.
APL LongGolden cross about to happen on monthly time frame (By the start of next month).
It broke out its all-time high, touched Fib 1.618 level and then retraced back to retest.
Currently breached its 10 moving average on monthly chart and weekly 50 moving average gave it support.
Its easy target can be 734 if it jumps again after the golden cross.
OGDC - LongFrom a technical point of view, the first target should be Rs 237, and the long-term target is Rs 335.
On fundamental grounds, the current fair value of this share should be around Rs 228, but if the circular debt issue is resolved and the company starts giving dividends around Rs 40 - Rs 45 than the fair value will jump to around Rs 350, so it is a good bet both technically and fundamentally.
Do your own research(DYOR)
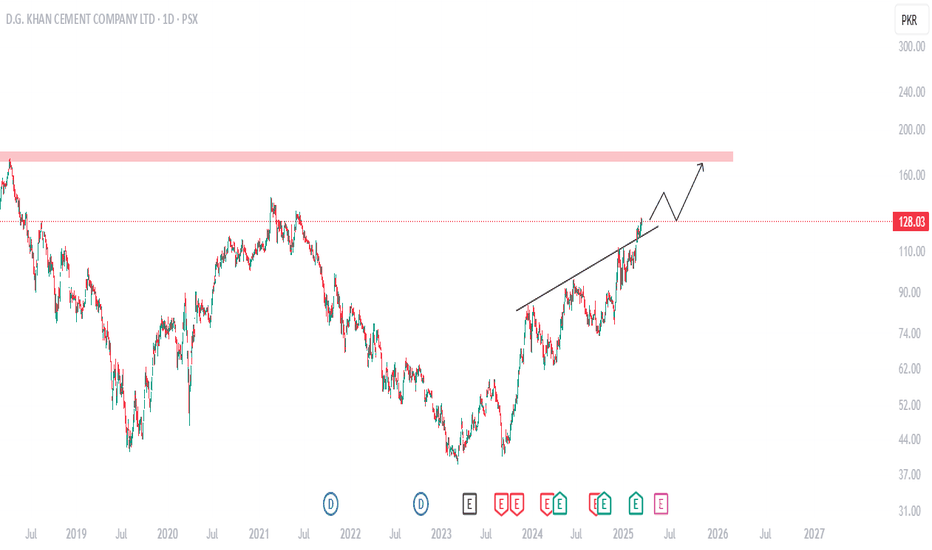
Market Trends Favor DGKC: A 40% Gain in Sight?it is up against a multi-week resistance line once again, Several industry peers have already surged past key levels and Some of the producers already broke out and DGKC eventually shall follow suit. I personally expect DGKC to quadruple without much effort upon breakout to gain 40%.
PSO Showing Strong Signs of Trend Reversal Pakistan State Oil (PSO) appears to be shifting its market structure after a prolonged correction. The most notable signal is that no new lower low was formed, and the previous lower high has been decisively broken, indicating a potential trend reversal. This breakout is backed by a significant rise in volume, suggesting that smart money might be entering the stock. Additionally, RSI has crossed above 60, which reflects growing bullish momentum. Based on this setup, a trade plan could involve a first buy zone around 382–385 (breakout confirmation) and a second buy zone at 360–363 (in case of a pullback). A stop loss below 338 keeps risk defined, while targets at 409 and 445 provide a favorable risk-reward ratio. All key indicators—market structure, volume, and momentum—are aligning to support a potential upward move in PSO. Keep this on your radar, as this could be the beginning of a strong bullish cycle.
Still Bullish on Bigger Time Frames.Still Bullish on Bigger Time Frames.
Hidden Bullish Divergence has appeared.
Immediate Resistance lies around 186 - 189
Crossing this Level with Good volumes may
expose 197 - 200
Fresh Entry should be Triggered if 205 is Crossed
& Sustained; only then it may resume its Uptrend.
PREMA Stock Analysis: Uptrend Intact, But Is a Pullback Coming?The stock is in an uptrend, as seen from the ascending trendline support.
Recent price action shows strong bullish momentum, with consecutive green candles pushing the price higher.
A potential consolidation phase is expected before another upward move.
Short-term Demand zone 33-34 PKR
Strong Demand zone around 28-30 PKR,
POL PROBABLY IN WAVE 'C' OF CORRECTIVE PATTERN DOWNPOL is most probably in a corrective wave down which has started after a strong impulse wave up. Currently the market is in wave C of the corrective pattern downwards.
As per our prefer count, on the minor level we are currently in the 5 wave of Wave C, which is either complete or will get extended further down. Once the price closes below 549 it will open targets for wave 5 extension levels as per Elliott wave rule. Also in addition it will give confidence in the Double Top pattern and we can use the chart pattern as well to determine the targets. Remember volume is the key indicator here.
On the other hand if the wave 5 of Wave C is over, then we are in 1 or A wave of an impulse or corrective wave up. The formation of the wave will help us determine the upside targets if price does break above last swing high.
Let see how this plays, Good Luck !
Disclaimer: This is for informational purposes only; anyone taking trades using this idea will be liable for their own profit or loss.


