LongIt should not break 334.
upside targets are around 390 & then above 400.
If 465 is Crossed & Sustained, we may witness 600+

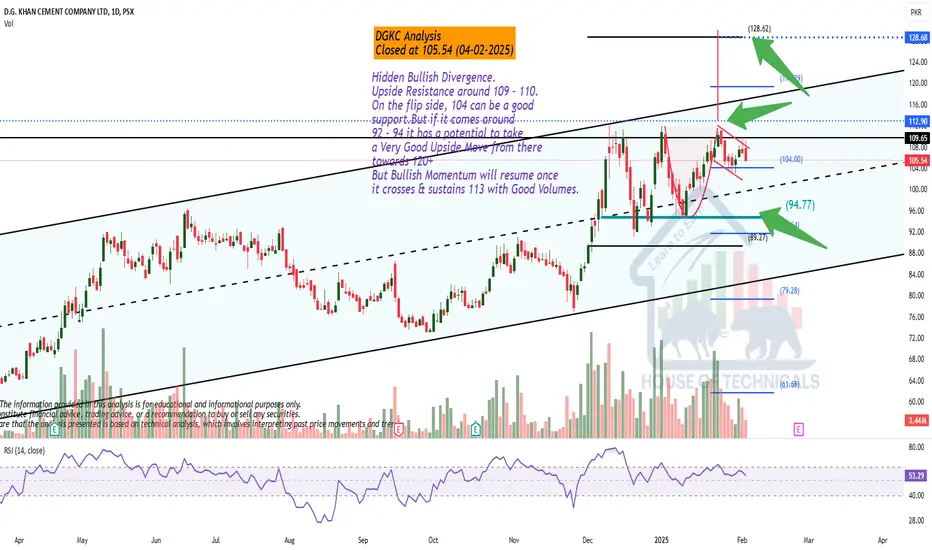
Hidden Bullish Divergence.Hidden Bullish Divergence.
Upside Resistance around 109 - 110.
On the flip side, 104 can be a good
support.But if it comes around
92 - 94 it has a potential to take
a Very Good Upside Move from there
towards 120+
But Bullish Momentum will resume once
it crosses & sustains 113 with Good Volumes.
PIOC on the movePIOC needs to be watched and placed on watchlist as it is anticipated that its going to give a good move towards the upside. It is approaching EMA50 and EMA100 from below and a crossover of the two EMAs is about to take place soon, hopefully.
Daily RSI-14 has jumped upwards after touching min 36.84 to the current 50.18 and a positive crossover has taken place on the MACD, though it is yet to cross the Zero Line towards the upside on the DTF. Lets c how it plays, further.
Potential Targets given on chart. There is a falling wedge Target approx. @ 250-255.
Wish you all Happy Trading 📈

GHNI-BULLISH FLAGThat stock is moving in three patterns but in my vision its break its resistance and carry forward its upward momentum in future.

FFL - NEUTRALThat stock is in falling mode now take observation on the moves in future with the respect of support and resistance .

CPHL | Trade SetupCPHL is currently in an overbought zone, and profit-taking is advised at higher levels. The price action has surpassed its previous high of 101, reaching a new peak of 109.30. The previous resistance at 101 now serves as a support level, and a long position may be considered once support is firmly established around this level. The next potential target for the upcoming impulse move is approximately 118. To manage risk effectively, a stop-loss should be placed below 92.50. This swing trade setup anticipates a potential gain of 16.83%.

HCAR | Expected 100 Rupee Gain!Take a look at what we have here! I believe we can all agree that this chart is quite intriguing.
HCAR is showing bullish momentum after an uptrend making higher highs and higher lows pattern. The price is currently retesting for establishing its low. A possible pullback might be expected in its price action.
We’re likely to see a new bullish wave towards 400 level which is almost 33% gain but I believe there’s potential for significantly more growth in the months ahead.
Thank you so much for your continued support. Let’s ride this bullish wave together!

TRG: IN BULLS CONTROLCurrently TRG is trading above a critical level, as marked on the chart. We may initiate a long position with risk and tp defined on the chart.
Good Luck

trg about to breakoutfollowing symmetrical triangle perfectly, needs a breakout from 68.5 and then to 75.. or above shown divergence at 4hrs. previous up move could follow next expected price target. 4hr closing above rsi 50 is necessary for upward breakout

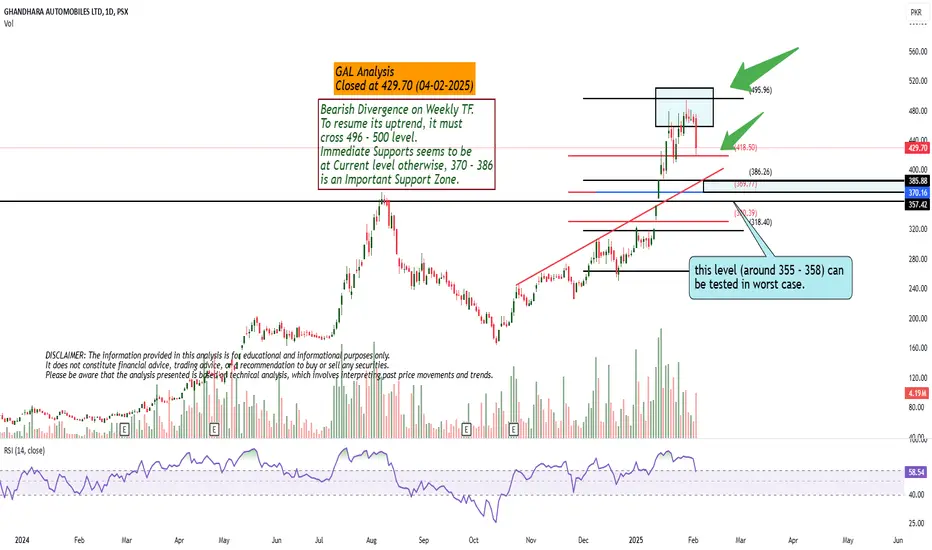
Bearish Divergence on Weekly TF.Bearish Divergence on Weekly TF.
To resume its uptrend, it must
cross 496 - 500 level.
Immediate Supports seems to be
at Current level otherwise, 370 - 386
is an Important Support Zone.

ENGROH, 1DCurrently stock in down trend most probability bonce back from 160-170. could be good buying zoon.


PSO, 1HCan be buy at current price looking good.
This analysis is for informational purposes only and should not be considered investment advice. Always conduct your own research and consult with a financial professional before making any investment decisions.

HUBC, 1Dlook like complete the fourth wave and target price 160 which is completed 5th wave
This analysis is for informational purposes only and should not be considered investment advice. Always conduct your own research and consult with a financial professional before making any investment decisions.

ATRL - Attock Refinery Ltd. 1DBased on my analysis, ATRL is showing weakness and approaching crucial support levels.
- The descending triangle pattern suggests potential bearish continuation.
-it could be take support from 550 to 520 zoon looking partial buying in that area
This is my personal view and not financial advice. Trade accordingly.

BULLS for FFC Buy from 380-382
sl 375
tp 395.32
key points:
market created strong reversal and entry on 1 hr support
RSI oversold suggests weak bears and inflow of strong bulls
Thankyou

Technically, Weekly candle close: Fundamentally, Better EPSWe need the two signals.
This week it touched the lower trenline of daily channel. yet no candlestick confirmation.
1st, candle stick pattern close on weekly basis.
2nd: Quaterly report is expected in next two weeks which will confirm the technical movement.
A positive report will boost the bullish sentiment to first @70 area and upon break the trenline resistance, it will move further to 100.... matlab century to marega..
A negative report will dump it and price may drop to its monthly fibb level at 60% around 45 area.
Lets' wait and see. I will think about the position next week upon weekly candlestick closure.

FCEPL in a range zoneFCEPL is trading in a range zone,currently price is at support and showing bullish signs,good oportinuity for buying at this level.

Though Bullish on Bigger Time Frames but..Though Bullish on Bigger Time Frames but it has Started making LH LLs on Daily TF.
Currently at Important Support level.
Bullish Divergence has appeared that should give it a Bounce.
If 345 is Sustained, we may witness slight upside may be around 375 - 385.
If 391 is Crossed with Good Volumes & Weekly closing is above this level, we may
see it touching 415 - 420 which is again an Important Resistance level.
However, if 345 is broken, 320 - 325 is a level that can be touched in worst case where
Bearish ABCD pattern target will be touched.

Make it or Break it Situation.
Currently Near Channel Bottom around
935 - 940.
Either it should bounce from 932 - 935 or
otherwise breaking 930 would open ways
towards 827 - 830.
As mentioned many times in my earlier analysis
that the Bullish Momentum would resume only
if it Crosses & Sustains 1200 - 1250 atleast.

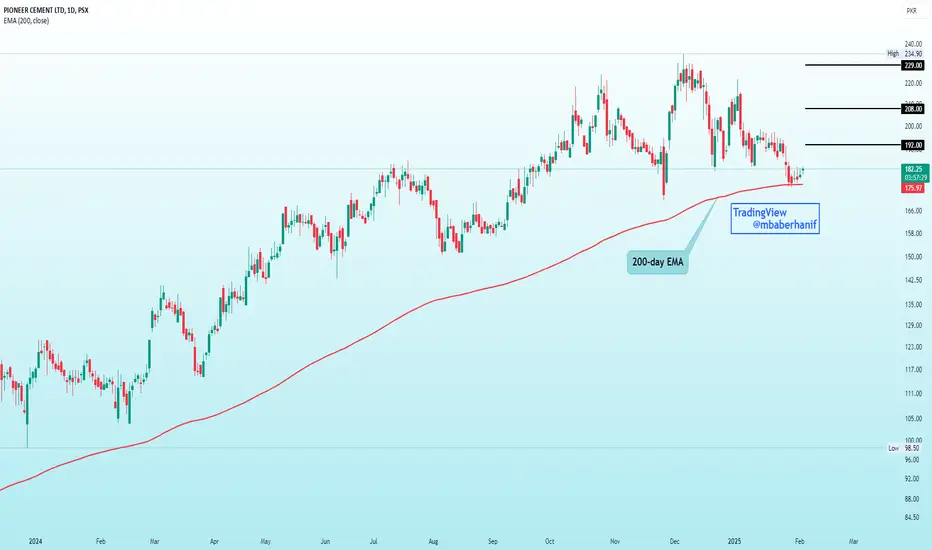
PIOC Respecting 200 EMAPIOC has experienced a pullback after testing the 200-day EMA and is currently trading 3.60% above it. Notably, the stock has been in an uptrend since March 2023, consistently hovering above the 200-day moving average. An initial target of approximately 192 is anticipated in the coming days. If a breakout occurs, the price may advance towards 208, with a potential test of its previous high around 229 from a swing trade perspective. A stop-loss is recommended if the stock falls below the moving average, as this would indicate a shift toward a downward trend.
EXIDE - LongEMA 200 reststing done
Old GAP refilled
Range bound.
Targetis around Rs 900 + (highlightd with yellow line)
