Currently at a Very Good SupportMonthly Closing above 58 would be a positive sign.
It is Currently at a Very Good Support & it should bounce
from this level towards 60 - 62.
However, Next Support levels are around 55 - 56 & then 49 - 50.
More Positive Momentum will start after 71 - 72.
Initial Resistances are around 63 - 65 & then around 82 - 83.

Technically Buy Fundamentally No TouchFundamentally, PSX:SNGP has a serious issue due to its valuation i.e Decreasing Free Cash Flow and ROE.
Therefore I am not taking a long term position
Technically: I am still interested in it. A Bullish reversal @84 area can lead to Buy position till 137. We need this confirmation on both Daily and Weekly timeframe.

still Bullish on all Time frames.Evening Star formation on Daily TF.
However, it is still Bullish on all Time frames.
It is currently at Make-it or Break-it sitaution.
Next Support is around 17.90 - 18.50
On the flip side, 24.50 is an immediate resistance.

NRLA "double bottom buy stop" strategy is a trading approach based on technical analysis. It involves identifying a specific chart pattern known as a "double bottom," which consists of two consecutive troughs at approximately the same price level separated by a peak. The strategy entails placing a buy stop order above the peak that separates the two bottoms. This order is triggered if the price surpasses that level, indicating a potential bullish reversal. Traders often use additional tools and indicators to confirm the pattern and manage risk effectively.

Still Bullish on Bigger TF.Still Bullish on Bigger TF.
But the Bearish Divergence is
not letting it move upside. However, it is
currently near its Trendline Support. It
should bounce from 95 - 96.
& If 91 - 92 is broken, we may witness 85 - 86.
On the flip side, Crossing above 104 - 105 may
lead it towards 114 - 115 initially.

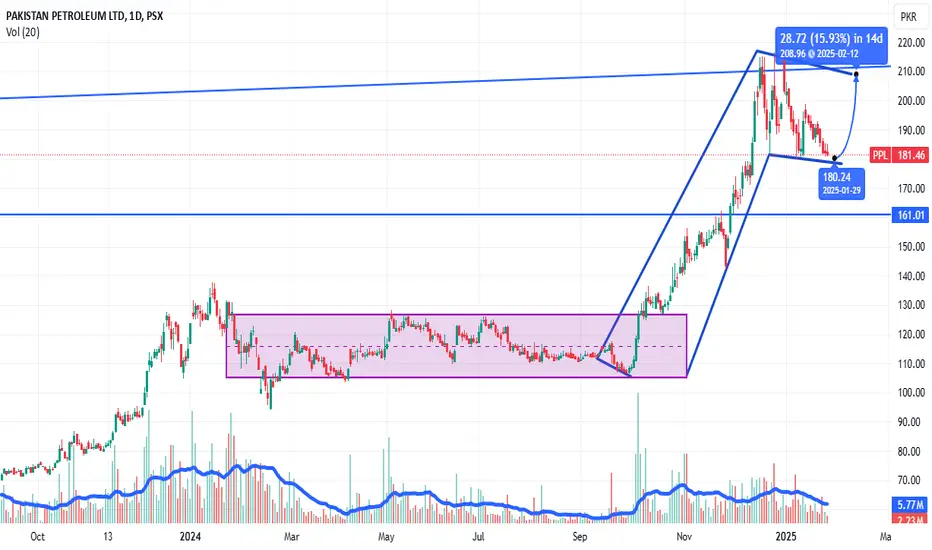
Bullish Momentum in the makingPSX:PPL Pakistan Petroleum Limited is in consolidation mode for almost a month now.
Technically it made a flag which where the prices are moving within the cloth.
We now need volumes and a candlestick bullish signal on daily timeframe to take our position around 180 area.
BTW I am not taking this position because I already took my position.

MARI will not give upMari is giving a good opportunity to ride at current retracement phase. Currently it is at 23% Fibb Level where i made a good hammer candlestick with nice volumes on daily chart.
1st Buy Reason:
Great Management, Nice Fundamentals. Trading at Accummulative Level.
2nd Buy Reason:
Wanted to Buy many shares on 1st Buy. But Couln't did at that time. Invested again when money came in.
3rd Buy Reason (Will do on Friday Dt 24-01-2025:
I always buy good stocks if it goes down -9% within a week.
Trading at 23% of Fibb Retracement
Signalling a good hammer + volume increase.
4th potential Buy: Around 464 Level
5th potential Buy: Around 360 Level

KAPCOmonthly analysis of kapco.
this trade is long time hold .
Bulish divergence then beark last LH .print 1st HH.
also reversal patren head and shoulder and beark the neckline ,
Anticipate price goning up and print 2nd HH with projection of head and shoulder target.
Target is 50.


SSGC-LONGpotential stock it will perform in future keep in your portfolio also and wait for achieving target

MARI - PSX - Trading in Sideways Trend for 20% gainMARI is moving between 660 to 740 over the past one month or so.
KVO is dipping which suggests a further dip in price. RSI is also dipping much below Zero level.
Therefore, I'm eager to see it test 610 level once more. However, this is No 1 Stock of PSX and may attract Buyers at any time. Therefore, I'll buy in steps to make sure I have the stocks at lower rates.
Trade Values
Buy-1: 660
Buy-2: 640
Buy-3: 620
Buy-4: 610
TP-1: 708
TP-2: 720
TP-3: 735
SL: 600
Buy-5: 760 (Once price moves above this parallel channel sufficiently)
SL-5: 745

Feroz Technical Analysis: Potential Buy OpportunityFeroz currently displays a bullish trend supported by key indicators. Price has rebounded from a trendline and is trading above the 89-day EMA, a historically significant support level respected by the price action. A recent support zone bounce and alignment with the Fibonacci Golden Ratio further strengthen the bullish outlook. Buy levels are 330 (CMP) and 310, with a stop-loss set on a closing price below 275.
Happy trading!

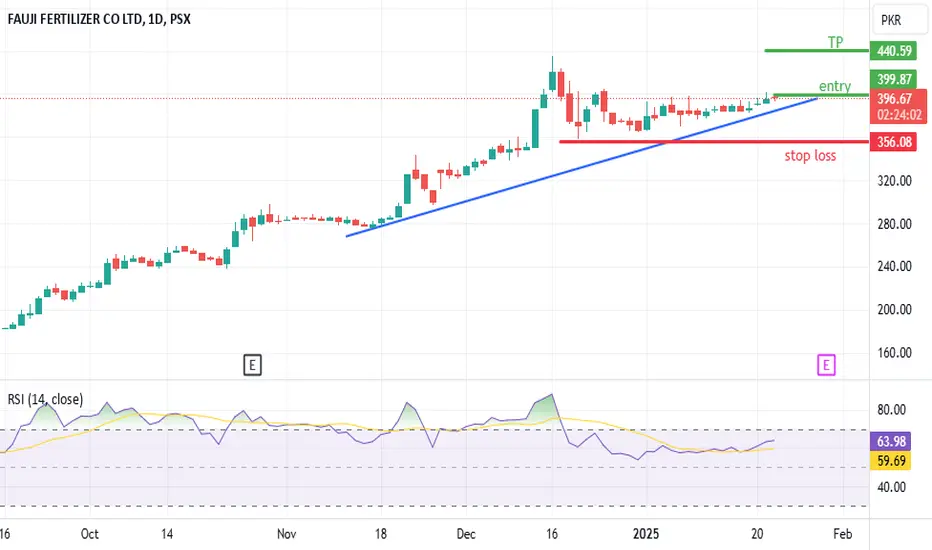
FFC continuous bullish momentumFFc is in uptrend for quite a long,price has taken a correction good oportinuty for buyers to accumalate at current levels.
SYM - PSX - 4h - Sideways TradingSYM on 4h trading sideways range. Price is currently at a buyable range.
A parallel channel has been drawn, where price will remain in the range.
Trade Value
Buying Zone: 17.80 ~ 17.30
TP Range: 18.80 ~ 19.30
SL: 16.90

FLYNG - PSX - Technical Analysis for Sideways TradingOn 4h time frame, FLYNG was slipping down in a regression channel, continuously making LHs and LLs. Now it has broken out of the regression channel and moving upwards.
Seeing overall KSE-100 moving sideways, this SCRIPT is also expected to move in sideways.
So the trading strategy should be to buy on dip and sell on previous price resistance.
Trading values:
Buy-1 (CMP) : 27.26
Buy-2: 25.00
SL: 20.82
TP-1: 29.53
TP-2: 31.71

PAEL-LONGStrong momentum can be start soon according to bullish peanut formation capable stock to buy it at that price and hold it upto target.


Ptc could drop more Ptc completed its Bullish Elliott wave now it is in bearish Elliott wave and it completed its 4th step and heading to 5th step and it could drops more.
Note: This is not a buy or sell call. Use stop loss.

MEBL - PSX - Technical AnalysisMEBL is in sideways for almost seven months now. It is very much likely to continue in that fashion as interest rates cut is expected further.
Therefore, buy on parallel channel's bottom and sell on its top is recommended.
GANN support & Resistance fanes and Fib retracement tools have been used. Price has honoured both GANN and Fibonacci for this SCRIPT. Therefore, one can draw confluence while taking trades in this SCRIPT.
RSI is at a mid-range emphasizing on continuation of small uptrend and then fall down. KVO is also a bit bullish (above Zero), but KVO indicator line has crossed its trigger line as well which may hint at price going up.
Trade Values
Scenario ONE:
Buy-1 (Mkt): 246.64
TP: 271.75
Scenario TWO:
Buy-2: 284 (If price breaks the resistance)
TP-2: 327
Stop Loss: 207

Though Bullish on All Time Frames but..Though Bullish on All Time Frames & also has
a Very Strong Monthly Bullish Divergence,
But Currently at a Very Strong Resistance around 8.
Either it should Sustain 8.15 or it should once
retrace upto the range of 6.35 -5.75 for a Good Upside Rally.
Upside it has the potential to touch 9.35 - 10 and then 13 - 14 initially.
However, it should not break 3.5.

OCTOPUS - PSX - Technical AnalysisOn daily TF, OCTOPUS is in a sideways channel since Nov 2024. Although it has broken out of downwards parallel channel but has actually not gotten into bull run.
Therefore, one can initiate trade in sideways channel as well as once it breaks out of the sideways channel.
KVO is in sideways and just below zero level, but Klinger line is above the trigger line. Which may move up. Similarly, RSI is also around 50, therefore, there is enough space to move up.
Trade Values
Buy-1: 68.10
TP-1: 77.34
Buy-2: 80.52
TP-2: 100
SL: 62.07

AVN | Inverse Head & ShoulderInverse head & shoulder pattern is observed in hourly time frame, that leads the price towards 62 - 63.70
