Hidden Bullish Divergence on Daily TF.Hidden Bullish Divergence on Daily TF.
However 35.50 - 36 is an Important Resistance
Zone that should be Crossed with Good Volumes.
Slight Resistance will be seen around 38 then.

GGLGGL has given the strong breakout of almost 2 years accumulation. currently it is holding the breakout firmly. And the good thing is bullish cross over is just ready to happens. If this breakout sustains we can witness the huge rally to the upside.


PTLPTL made a high of 54 and then came down 40.47 and bounced up from that levle and broke out the retracement line and its firt target would be 54.
SL would be 39.54


Monthly Closing above 16.90 would be a Positive Sign. Monthly Closing above 16.90 would be a Positive Sign.
Immediate Resistance is around 18.80 - 19.80
On the flip side, 15 - 15.50 can be a Good Support.
& if this is broken, next Support would be around
13.50 - 13.80 which is also re-test level of Channel
Breakout.

EPCL: Early Signs of Spring.After posting the intraday high of 93.48 on 26th April 2022 the security has never been able to come out of selling pressure. On 14th October 2024 the price of 30.01 was printed as the lowest of recent times. From this point onward the Bulls have been trying to get a foothold and some early signs of there success have been noticed.
For those who like to do bottom fishing may initate a long position as has been indicated on the chart, wheras who want to play even safer may go long when the price is above TP1.
For those who initiate long after TP1 the TP2 shall be 50.
Pl do share your opinion as we learn together.

TOMCL: Bulls are preparing to Charge.The security after printing higher high prices has been sideways for quite some time.
The trendline was successfully violated almost a month ago. Afterwards the bulls staged a 2 day rally followed by a sharp legged recovery on 20th Dec. This shows the momentum is in favor of bulls. So when the bulls succeed in closing the price above 37.60 we shall join them. Pl observe SL in your trading.
pl do share your thoughts as we learn together.


PSO: An opportunity to have a quick Profit.After a marathon rally up to 465 the security made a retracement to the fib. level of 0.5 and now it has the shown the signs of reversal.
Such are the good opportunity to make quick money. All the parameters of trade i.e. entry, SL and TP has been marked on the chart. You may trade accordingly.
Pl do tell me your opinion as learning is both ways.

GGLBeark the box and trend is bulish dow theory HH and HL.
trend line also fallow market.
RRR 1:1 target last High

EFERTtrend is bulish dow thery is making hh and hl.
now price is retracment at fib level 0.618%
target is last high.


SEARL Buy CallSEARL (PSX) has given a breakout from the pennant formation with decent volumes. Buy at mentioned price for a risk reward ratio of 2.22. Use trailing stop loss once it hits TP1. Enjoy Trading!

Learning GALPlease check the monthly cup and handle pattern if it is formed than it can give you crazy returns. This is for education purpose only.

Finally my Bullish Position executed for #CHCCChirat Cement has great financials. Over previous 10 years its CAGR is 14% which is fairly enough for me to put a tick mark on its financials.
I was waiting for this position 159 since 10 December 2025 . Today on 17th January 2025 it came to my zone made a small flag.
My target is around 392 zone where i will be able to think about selling and taking the profits no matter what ever it takes.
Also if comes down, I will buy more.

Thatta cement correction seems completedThatta cement seems completed its correction and ready to fly once again.
Note: This is not a buy sell call and use stop loss.

WTL (Triangle Breakout Possibilities)WTL is currently moving in a pennant and likely to give a breakout for towards mentioned TPs. Small qty trade should be taken without any stoploss.

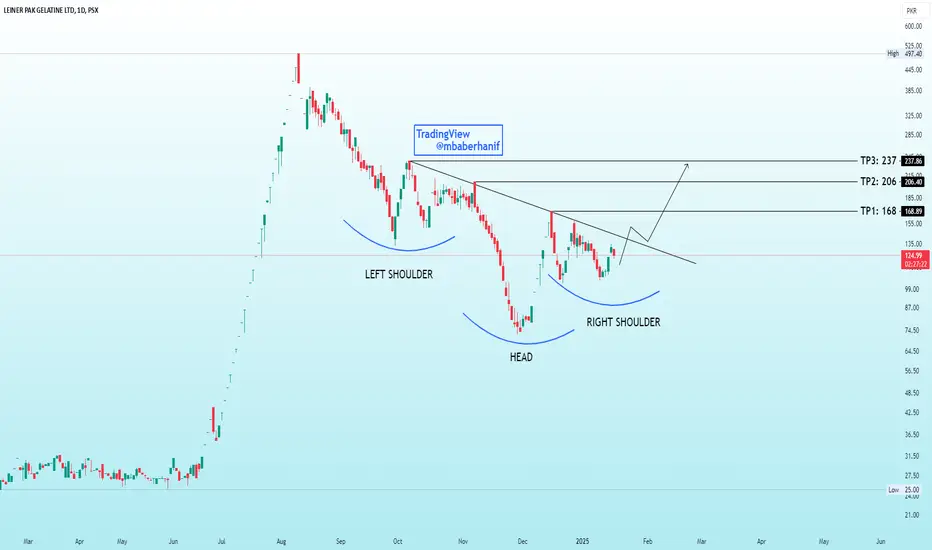
LPGL | Inverse Head & ShoulderLPGL forming head and shoulder patter in daily time frame, the price is currently below the descending trend line. Upon break out it can pump towards 168 - 206 - 237 levels. Long position can be consider below 124 and partial profit taking upon each target levels.
LONG AGHALonged AGHA. Bought spot shares, no leverage. Resting above monthly support. Entry, Stop Loss and Exit all there. Will take a while to play out. Nice reaction in august of that monthly support. Should hold for uptrend to continue. Patience is always rewarded. Worth a punt!
Will update in due time.
Manage your risk! #DYOR

Avoid buying KEL right nowHead & Shoulder pattern has been formed on KEL and it has already break the neckline. Buying in KEL should be consider on the levels of 3.70 - 3.50. Strong bearish divergence on RSI weekly and Monthly is also there. Trade with strict stoploss.

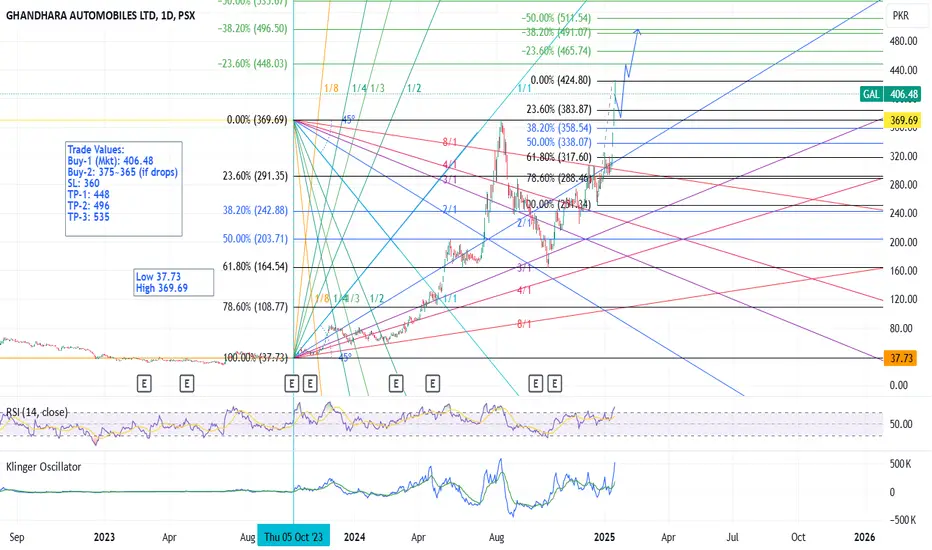
GAL - PSX - Tech AnalysisGAL has been moving up very sharply. After crossing the previous all time high now has established a support zone above it (365~375). Price has appreciated in one stretch quite a bit, therefore, I expect a retracement as well. So price may drop to 383 or even lesser.
RSI and KVO both are supporting a continuation of bull run.
TPs have been calculated on the basis of Fib Ext tool.
My trade values:-
Buy-1 (Mkt): 406.48
Buy-2: 375~365 (if drops)
SL: 360
TP-1: 448
TP-2: 496
TP-3: 535
Still Playing a RangeStill Playing a Range (as shared earlier on 10-12-2024).
Now, Hidden Bullish Divergence on Shorter TF.
Crossing 1116 - 1117 may lead it towards 1150
and then around 1190 - 1200.
On the flip side, 1050 - 1060 may act as a
Good Support & a bounce is expected.
Otherwise, if this level is Broken, we may witness
further Selling Pressure & price may touch 1000 - 10005
Fresh Entry is Recommended only if the
Channel is Broken Upside.
