Monthly Support.Important to Sustain 529 on Monthly basis.
It may hit 472 - 475 in worst case scenario.
The Bullish divergence on shorter tf may
move the price up towards 550 - 555.

Make it or Break it Situation.
Make it or Break it Situation.
Either it will reverse from the current
leve or it may touch 1235 - 1240.

Bearish Divergence has appeared.
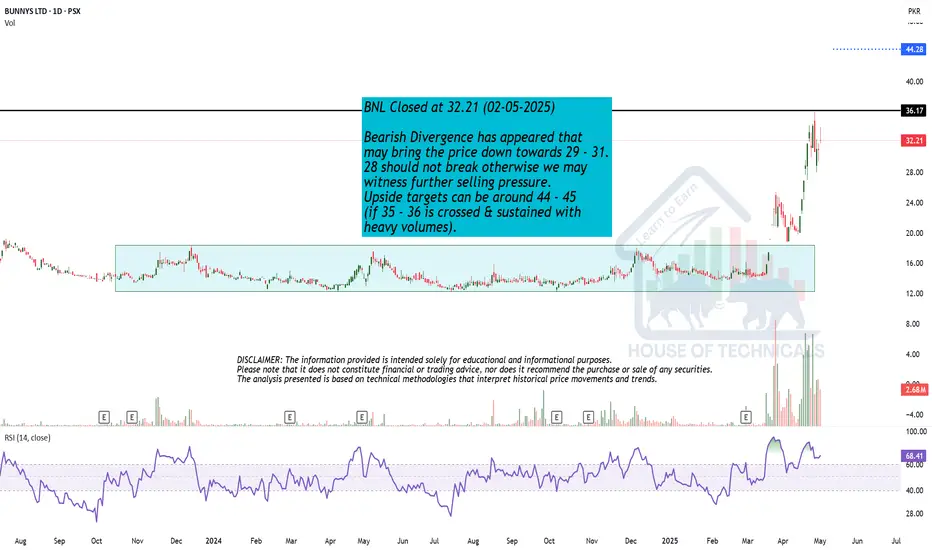
Bearish Divergence has appeared that
may bring the price down towards 31 - 32.
28 should not break otherwise we may
witness further selling pressure.
Upside targets can be around 44 - 45
(if 35 - 36 is crossed & sustained with
heavy volumes).
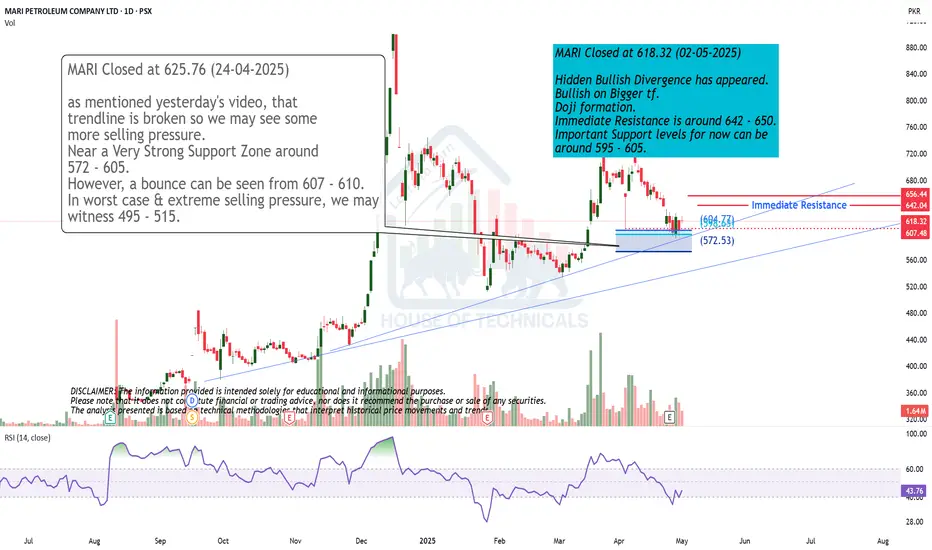
Hidden Bullish Divergence
Hidden Bullish Divergence has appeared.
Bullish on Bigger tf.
Doji formation.
Immediate Resistance is around 642 - 650.
Important Support levels for now can be
around 595 - 605.
H&S Pattern
Though H&S Pattern has formed but
Currently at an Important Support around
200 - 202.
Next Support lies around 193 - 196.
Though there is Bullish Divergence on
shorter time frame but its resistance is
around 226 - 231

Bearish Weekly Candle.Bearish Weekly Candle.
Capped & then heavy selling (today).
Last candle - Doji
Immediate Support Zone is around 58 - 63.
Reversing from this support zone would
expose 75 - 77 again.
Its safe as long as it stays above 36.

Bearish Divergence appeared.Bearish divergence appeared on Daily as well as
Weekly TF.
Strong resistance is there around 127 - 129.
Once this level is Crossed, we have open ways
towards 145 - 147
On the flip side, we have a good support around
120-122. However, breaking 116 this time will bring
more selling pressure towards 113 initially.

Bullish on bigger time frames.
Bullish on bigger time frames.
Took support from a very important
level around 36-37.
HL printed.
40.30 - 40.85 is a Resistance level as
of now.
If it gets rejected from this level, we may
witness 37.50 - 38.50 again.
Upside targets can be around 45 - 46 & then
50s.

BFBIO is entered into Bullish ZoneBFBIO is entered into bullish zone and may be it will cross 150 and 200 levels in few days. Stop loss is 118.
Note: This is not a buy/sell trade call. Trade at your own will.

Searl entered into Bullish zoneSearl is entered into Bullish zone and may it cross 90 and 95 levels in few days. Stop loss could be 80 and 78.
Note: This is not a buy/sell trade call. Trade at your own will.

AVN in Bearish trend AVN in Bearish trend about to face a trend reversal RSI diversions can be seen. Entry with a buy stop above the last lower high

DGKC entered into bullish zoneDGKC is entered into bullish zone,
Note: This is not a buy/sell trade call.

Gal entered into Bullish zoneGal is entered into bullish zone and may gross 500 and 550 level.
Note: This is not a buy/sell trade call, it is for education purpose, use stop loss.

FFL SHORT TRADEFFL has broken down its major support with heavy volumes as shown by waves and their volumes.
SHORT FFL @ CP and 14.40
TP1 12.35
TP2 11.65
SL 15.1


LOTCHEM PROBABLY IN WAVE ' X ' OR ' Y ' OF A CORRECTIONAs per our preferred wave count LOTCHEM is in wave Y which should take prices further down toward the 13 level and if bearish trend stays strong then even 9.50 is on the cards, however prices need to break below 15.53 level first.
Alternately prices can still be in X wave and will take prices further up towards 25.40 - 27.40 range and if the bullish trend stays strong 31 level is also at hand, however prices will have to break above 20.20 level first.
As the overall momentum of the PSX is bearish and our preferred wave count is bearish, We will activate short sell trade once price close below the red trendline on the daily chart.
Incase prices never close below the red trendline and starts rising, We will enter long position at 20.20 targeting 25.40 range. I will share stop loss for the trade setup once our trade gets actived
Let see how this plays, Good Luck!
Disclaimer: The information presented in this wave analysis is intended solely for educational and informational purposes. It does not constitute financial or trading advice, nor should it be interpreted as a recommendation to buy or sell any securities.

PAEL SETUP ONCE AGAINPAEL is currently at its orderblock zone where the liquidity is resting if volumes come in at this level then we can expect a bounce again if the orderblock fails and there is no liquidity in OB then wait for downside levels and if the weekly ema 21 is broken then i see 30 level coming but still we will look into some more levels for now just focus on this orderblock
the previous supply is completed here

HH HLMonthly Closing is good.
Weekly closing above 29.50 would
be very positive sign.
32 is the Immediate Resistance &
if 36.10 is Crossed & Sustained with
Good Volumes, we may witness 40 - 45.

PSO Facing Trendline Resistance – Possible Retracement AheadMollyRonaldFx Report
The PSO 15-minute chart shows a strong bounce from recent lows, with price currently testing a well-defined descending trendline. Although today’s movement reflects bullish momentum (+2.22%), the resistance at this trendline may trigger a pullback. The projected short-term scenario indicates a potential dip towards the 348 support zone. A failure to break and hold above the trendline could confirm this bearish move. Watch price action closely near the resistance area for confirmation.

AKBL buying opertunity AKBL Buying Opportunity:
Analysis:
1. *Support Level*: AKBL shows strength on support, indicating potential buying interest.
2. *Buying Range*: PKR 37-34 seems like a reasonable entry point.
3. *Stop Loss*: PKR 32 provides a buffer against potential losses.
4. *Target Prices*: PKR 40-42 and PKR 45 offer potential
Next Steps:
1. *Monitor AKBL's Performance*: Keep an eye on AKBL's stock price and adjust strategy as needed.
2. *Stay Informed*: Stay up-to-date with market news and analysis.

ENGROG LONG TRADEENGROH has taken support from its long term trendline.
Though it gave a good bounce but still it needs positive closing above 169 tomorrow
Buy if it crosses and sustains above 169
TP 196
SL 161

Consolidation BoxBBFL Closed at 53.24 (25-04-2025)
Currently in consolidation box.
Crossing 55 - 56 may lead it towards 63 - 65 initially

Approaching important Support Zone..Important to take Support from
this Level ( 21.30 - 22.50).
Otherwise more selling pressure
will be observed.
