a Very Important Level to Sustain.a Very Important Level
to Sustain.
Inverse H & S on 15mins TF.
Immediate Resistance around
103.50 - 105.20; Crossing & Sustaining
it will lead the price towards 115 - 116.

Long engroPrice on a weekly chart is an bull tight channel price on a daily chart is also in a very by the close type of bol channel price on 4 hour chart is abul channel it's tight and no fullbacks for the last one two three four candles right now the price on 4 hour chart is almost like a range its farming inside bar and also a triangle and price on the one hour chart is in a tight trading range so we are setting up by or I don't see any indications for the price to move down since we are trading ranges so we will first we will try to buy at the bottom of the range set a stop loss at my down from the range and target as one to

Analysis of AVN Stock: Bearish Trend and Short SellingIn our recent analysis of AVN stock, we have identified a prevailing bearish trend that suggests a strategic pivot towards short selling. The current market conditions indicate that the stock is poised for further declines, making it an opportune moment for traders to consider short positions.
Key indicators suggest that AVN's price may continue to drift lower, reinforcing the idea of a potential downtrend. Our analysis has determined a target price level where we believe the stock could reach its lowest point in this cycle. This provides a clear framework for risk management and profit-taking for those engaging in short buying.
Given the negative sentiment surrounding AVN and external factors impacting its performance, we recommend closely monitoring market developments while positioning oneself to capitalize on anticipated price movements. As always, prudent risk management strategies should be employed when trading in bearish conditions.
Overall, with careful consideration and strategic execution, there are promising opportunities within the current landscape of AVN stock for savvy investors looking to navigate this bearish phase effectively.

FABL | Growth Potential AheadAccording to its price action, FABL is currently trading within a corrective structure, with a strong support zone identified at 45, offering a strategic entry opportunity for long positions. The price is moving within a downward-sloping channel, indicating a consolidation phase, with a potential breakout towards higher levels.
Entry Zone: Around 45
Stop Loss: Below 43
TP1: 51
TP2: 54
Risk To Reward Ration = 1 : 4.50

BWCL is BULLISH for long term investors.BWCL is BULLISH for long term investors.
BWCL has a target to hit 2000 in the long run. However, the way to the peak is quite BUMPY route.
Target for 2025 should be accumulation and may reach to hit 500.
To be cautious one scenario seems to be BEARISH for midterm, and from 500 it can breakdown towards price of 100. After that it shall start a very strong rally towards 2000.
GOOD LUCK
DISCLAIMER:
The information provided doesn't guarantee results. 𝙏𝙧𝙖𝙙𝙞𝙣𝙜 𝙞𝙣 𝙛𝙞𝙣𝙖𝙣𝙘𝙞𝙖𝙡 𝙢𝙖𝙧𝙠𝙚𝙩𝙨 𝙘𝙖𝙧𝙧𝙞𝙚𝙨 𝙧𝙞𝙨𝙠𝙨. Individuals should perform a thorough analysis and consider their risk tolerance before making investment decisions. 𝙄 𝙖𝙢 𝙣𝙤𝙩 𝙧𝙚𝙨𝙥𝙤𝙣𝙨𝙞𝙗𝙡𝙚 𝙛𝙤𝙧 𝙛𝙞𝙣𝙖𝙣𝙘𝙞𝙖𝙡 𝙡𝙤𝙨𝙨𝙚𝙨 𝙧𝙚𝙨𝙪𝙡𝙩𝙞𝙣𝙜 𝙛𝙧𝙤𝙢 𝙖𝙘𝙩𝙞𝙤𝙣𝙨 𝙗𝙖𝙨𝙚𝙙 𝙤𝙣 𝙩𝙝𝙞𝙨 𝙥𝙤𝙨𝙩. Consult with a qualified financial advisor before entering to trade in stocks.

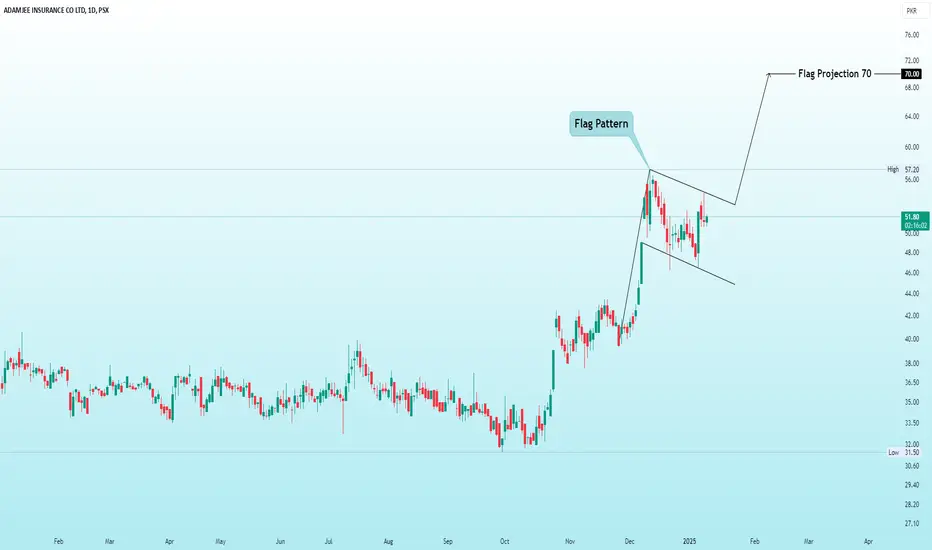
AICL | Flag Pattern FormationAICL forming flag pattern which need to break for the projection towards 70.
CSAP LONG OPPERTUNITYCrescent Steel and Allied Products Ltd. (CSAP) on the Pakistan Stock Exchange (PSX). Below is an analysis based on visible indicators:
Observations:
1. Price Levels:
Current price: The chart indicates the stock is trading near PKR 108.80.
Support level: Around PKR 102.25.
Resistance level: Visible near PKR 124.51.


IMLIML is in uptrend, break out is required for reaching its all time high level, current price is around 20 and have potential to reach ATH level around 45 in upcoming weeks.

Re-testing of Cup & Handle breakout???HL still intact; seems like Re-testing of
Cup & Handle breakout.
In the worst cases, if it breaks 48, it may
touch 45 - 46.
However, if 48 is Sustained on Weekly basis,
we may witness Upside around 55 - 56 initially
& then Crossing & Sustaining 57, will lead it
towards 70+

SSGC showing bullishnessSSGC has taken a due correction and know showing bullish signs, current level is good for buying

FFL Long IdeaA bit late, but it still has the potential to make an impact.
All targets and stop loss given on the chart

Make it or Break it..Selling Pressure was observed in last
couple of trading days.
But still it did not break its HL yet & is Still
Bullish on Bigger Time Frames.
Currently it tested its Trendline Support;
so this can be a Make-it or Break-it Level.
It has the Potential to touch 124 - 125 once
it Crosses & Sustains 116.

Cup & Handle Formation on Weekly TF.
Immediate Resistance is around 55 - 55.20
which may seems to break this time with
immediate targets around 60.
& if 60 is crossed with Good Volumes, we may
witness New Highs around 71 - 72 & then may
be around 80, 81 & 90.
On the flip side, it should not break 36.

TRG SHOWING EARLY REVERSAL SIGNSAfter a spell of bearish move the script has shown resilience. It has broken the recent high thus showing the bulls strength so we can join the band wagon to make some profits.
pl exercise the strict money management for profitable trading.
what is ur opinion

FFL still offers confirm 9% returnsThe stock has alhamdulillah achieved TP1 and now riding towards TP2 of 19.28.
Instant entry can be made here for 9% quick gains

Bearish Divergence on Daily TF + Bearish Divergence on Daily TF +
a very Strong Resistance around 50.
Next Support seems to be around 34 - 35.
and if 32.50 is broken, we may see trend reversal.

HUBC IS BULLISH IN & AFTER 2025HUBC IS BULLISH IN & AFTER 2025
2025 targets.
HUBC should be accumulated at current prices or if it retraces back in coming months (Q2-2025).
It may hit ~275 by the end of 2025 or in Q12026.
DISCLAIMER:
The information provided doesn't guarantee results. 𝙏𝙧𝙖𝙙𝙞𝙣𝙜 𝙞𝙣 𝙛𝙞𝙣𝙖𝙣𝙘𝙞𝙖𝙡 𝙢𝙖𝙧𝙠𝙚𝙩𝙨 𝙘𝙖𝙧𝙧𝙞𝙚𝙨 𝙧𝙞𝙨𝙠𝙨. Individuals should perform a thorough analysis and consider their risk tolerance before making investment decisions. 𝙄 𝙖𝙢 𝙣𝙤𝙩 𝙧𝙚𝙨𝙥𝙤𝙣𝙨𝙞𝙗𝙡𝙚 𝙛𝙤𝙧 𝙛𝙞𝙣𝙖𝙣𝙘𝙞𝙖𝙡 𝙡𝙤𝙨𝙨𝙚𝙨 𝙧𝙚𝙨𝙪𝙡𝙩𝙞𝙣𝙜 𝙛𝙧𝙤𝙢 𝙖𝙘𝙩𝙞𝙤𝙣𝙨 𝙗𝙖𝙨𝙚𝙙 𝙤𝙣 𝙩𝙝𝙞𝙨 𝙥𝙤𝙨𝙩. Consult with a qualified financial advisor before entering to trade in stocks.


MTL (Millat Tractor Limited)As our previous signal Hit TP 🎯, you can check our previous signal.
Now it can retrace down 641 ~ 662 Fib Golden Zone and It may go up again after retracement.
Stop Loss would be 635.
