NEXT- PSX- Buy OpportunityNEXT is in a bullish trend as it is making HHs and HLs. Look for buy opportunities at current levels and place your SL below previous HL.

UBL - PSX- Buy OpportunityUBL is in a powerful bullish trend making HHs and HLs. Look for buy opportunities on corrections.

PKGI - PSX - Buy OppotunityPKGI has recently broken out of an accumulation phase and has tested a prior resistance level, which has now turned into a support zone. Additionally, the 21 EMA is providing strong support, reinforcing the bullish outlook at the current price level. Consider entering a long position with a stop-loss placed below the current weekly support level.

NRL Stock Analysis: Long Buy OpportunityNRL is currently demonstrating a strong upward trend, making it an attractive candidate for long-term buying. The stock has shown consistent bullish momentum, supported by increasing trading volumes and positive market sentiment.
Technical indicators confirm that NRL is well-positioned within the trend, with no immediate signs of reversal. This suggests potential for continued growth, making it an ideal entry point for long-term investors aiming to capitalize on its upward trajectory.
Investors are advised to monitor key resistance levels while keeping an eye on broader market conditions that may influence the stock's performance.

HBL PSX IS STILL BULLISHHBL PSX appears bullish on both daily and 4-hour charts, suggesting a potential opportunity for prolific gain. HBL stock may be bullish in the short term. However, it is important to do your own research before making any investment decisions.

SYM - PSX - Technical AnalysisSYM is in bull run.
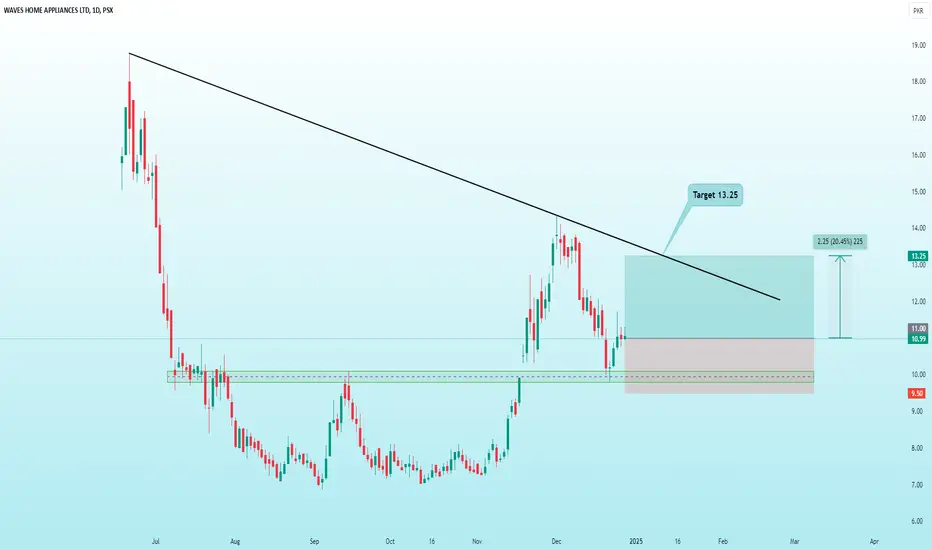
At present KVO is suggesting a strong bull run; however, a bearish divergence has formed on RSI, which may cause the prices to retrace a bit which is good as then a Higher Low of the Bull cycle will be defined and then price will again go up. Therefore, buy on dip is quite possible but in case price continues to go up then Buy-3 should be executed, otherwise Buy-1 and Buy-2 would suffice.
Trade Value:
Buy-1: 17.17 (at fib 0.38 retracement)
Buy-2: 16.33 (at fib 0.50 retracement)
Buy-3: 20.11 (if Buy 1 and Buy 2 are not triggered)
TP-1: 21.67
TP-2: 23.63
SL: 12.30

MARI Petroleum good support zone MARI Petroleum good support zone
Buy Big
Next move will be above PKR 1000/-

LUCK Cement looks BullishLUCK made High 1283 and then retraced down to 1050 and then
LUCK is bounced from Fibonacci Golden Zone
and expected to go up with first Target :🎯Price can be :1283
TP2: 1454
TP3:1725
Stopp Loss should be: 1040

PAEL Long positionReasons for long position
Monthly EMA 200 breakout
First time Lower High broken on weekly chart
Profitability continuously improving from the last 5 quarters
These are initial targets, not the final ones.
TP1: 44
TP2: 56
SL1: 36
SL2: 29

KSE 100 - HCAR - long or short?HCAR is currently in a strong bullish trend, with no signs of a reversal yet. The price is still showing upward momentum, and the trend remains intact. At the current level, it presents a good buying opportunity.
Entry: Buy at the current price level.
Stop Loss: Set at 263 to manage risk.
Take Profit: Target 398, with potential further movement towards 400, where the AB=CD pattern completes and aligns with a key resistance level.
The AB=CD pattern completion at 400 suggests that this area may act as resistance, so it’s critical to watch price action closely as it approaches this level. However, the overall trend is still bullish, and as long as the price remains above the 263 support level, the upward momentum should continue.

NRL Monthly-Dec 24NRL ready ho chuka hai, last two months closed green, upcoming refinery policy and result improvement after IR cut will make it bullish

ISL-MonthlyOn the monthly chart 102, the bullish channel top and horizontal resistance confluence are at the top. Closing above will unfold the next levels

HCAR - Long PositionABCD can be followed. Medium term target is Rs.500.
Short-term targets are given on the chart.

CSAP, Bullish Pennant to fuel further rallyA bullish pennant has formed in CSAP and it' s likely to test resistance line from its ATH.

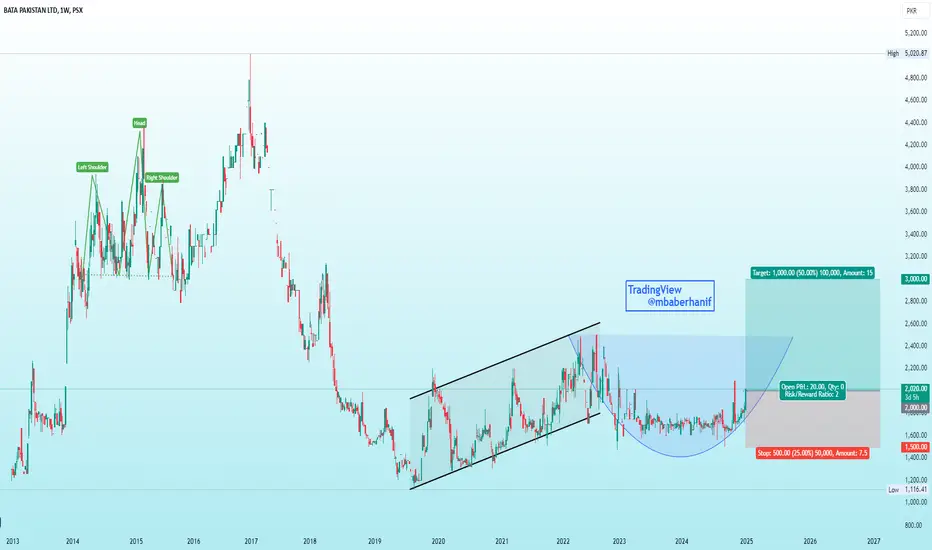
BATABATA is forming cup pattern, neckline resistance lies around 2,490, after reaching it can form its handle, upon break out price can test 3,000 which considered be the target.


Recently made a HL on Daily TF.Recently made a HL on Daily TF.
However, Bullish Momentum will continue once
the price will cross 52.
43 - 44 may act as an Immediate Support, & if
it Sustained on Weekly basis, we may witness
50 again.
But if 41 is broken, it may expose new lows
around 36 - 37.

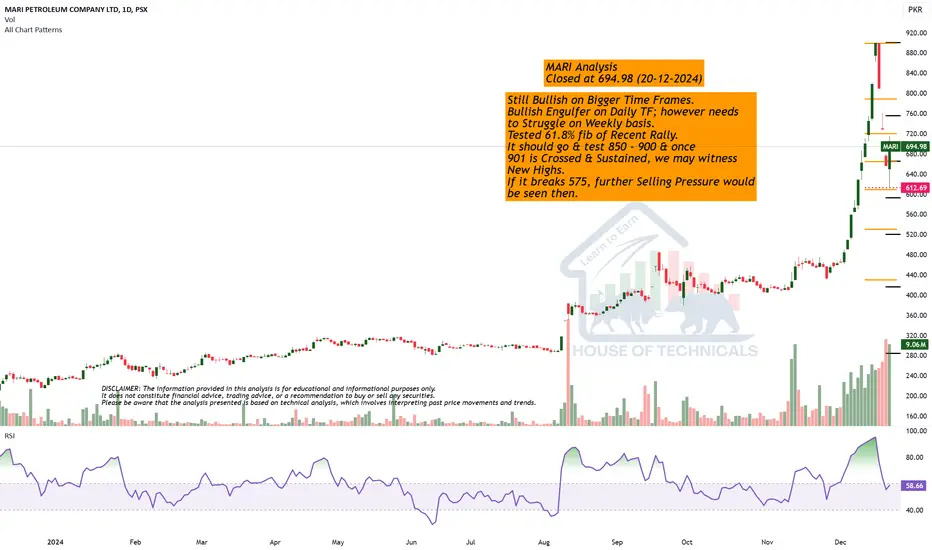
Still Bullish on Bigger Time Frames.
Bullish Engulfer on Daily TF; however needs
to Struggle on Weekly basis.
Tested 61.8% fib of Recent Rally.
It should go & test 850 - 900 & once
901 is Crossed & Sustained, we may witness
New Highs.
If it breaks 575, further Selling Pressure would
be seen then.
Still have Potential ...?Today it Capped & later it Lower Locked.
Picture will be more clear upon Weekly
Closing.

CLOV-BULLISH PEANUTbuy it at 38-40 rs and hold it upto target its in bullish peanut weekly timeframe

Stock is Bullish on Monthly TF.Stock is Bullish on Monthly TF.
However, 18 - 18.20 is a Strong Resistance Zone.
& if this level is Crossed & Sustained, 21 - 21.50
is on the cards.
Sustaining 22 with Good Volumes, will lead it
towards 26 and then 36.
Immediate Support Zone is around 14.10 - 15.
However, it should not break 12.
