Bullish on All Time Frames.
Bullish Divergence on Monthly Basis.
Falling Wedge Pattern on Weekly TF.
Crossing & Sustaining 14.70 may lead it
towards 18.30 - 19.50 initially.
11 is an Important Level that should not
be broken.


DGKC PSX IDEABased on previous bull run and support and resistance, DGKC looks good for long-term investment.

FABL PSXFABL is in good area to buy below 50 and target is 60+, SL and target are beautifully defined on the chart as shown.

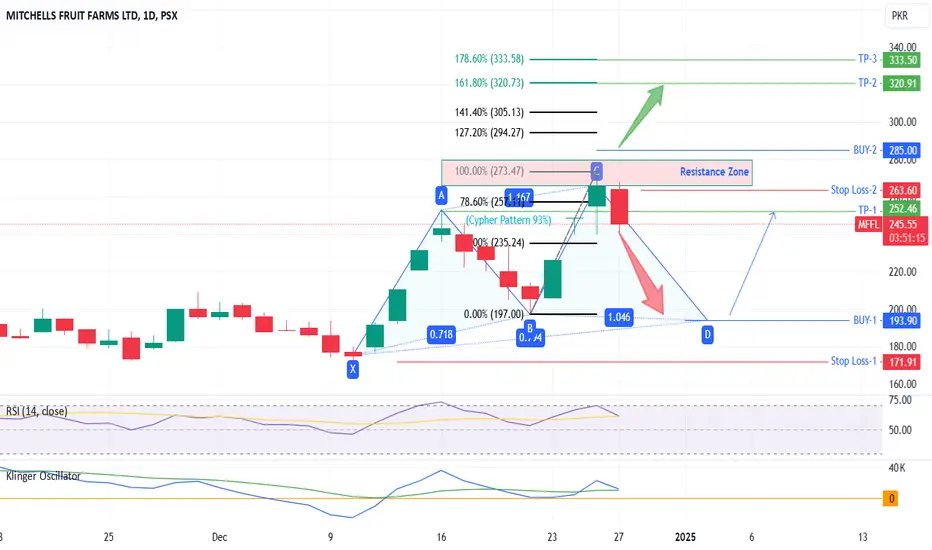
MFFL - PSX - Technical Analysis Bearish Cypher Harmonic PatternMFFL on daily TF, price has started to move downwards. It is following Cypher pattern and 93% chances are that it will follow it till price drops to 193~195. Additionally, RSI has also dipped close to 60 level and still going downwards. KVO also is dipping downwards but still above zero line; as soon as Blue line downwards crosses Green line price will start to drop sharply. If KVO dips below zero then selling pressure will be enormous.
Therefore, a cautious approach should be followed while getting in to it.
My recommendations would be to buy at dip of 193 and that too after analyzing it again as it may even slip to 120~130.
Alternatively, buying after it crosses 290 will be better approach as then it will be in the next bull run leg. TPs are calculated on Fib based Ext tool.
Trade Values have been marked on the chart.
ISL - Long positionSort of a cup and handle pattern formed.
First Target is Rs 105
Pattern Target is Rs 113-117.
Steel sector is not a great sector from an investment point of view considering the nature of the business; however, in a bull market, you can expect great results.

NBP looks for another rideNBP looks for another ride in 2025.
But before riding in Q1 2025 it shall continue its short term down movement correction and then start the rally up.

FECTC - PSX - Technical AnalysisPrice is just above EMA 21 on Daily TF which indicates that still this script is in the Bull Run. However, if price drop from here then it may drop till 95 and bounce from there. It may even slip to 73 as well. RSI is slightly sliding downwards but there is no divergence present. KVO suggest a balance state.
Moreover, Pole & Flag patterns have been repeatedly printed by this script and right now Pole is about to start.
Trade Values:
BUY-1: 103
BUY-2: 95
SL: 90
TP: 127
TP-2: 159

KOHC- PSX - Technical AnalysisKOHC - price moving in downwards parallel channel. It is at 4H support now and may bounce out of channel to test 450 resistance zone.
Otherwise, it may still go further down the parallel channel and bounce from 320~330 zone. RSI is indicating a further slip in price however, KVO suggest that price will stay static and may go either side. Therefore, if price drops below 360 then one must exit. And if planning to buy then better to buy on dip at 320~330.
And even better buying will be once the price crosses 460 after breaking the resistance zone of 440~450.


FFL - PSX - Monthly Technical Analysis - SHARK Harmonic PatternOn monthly time frame FFL is following SHARK Harmonic pattern.
In the present bull run, prices are moving up swiftly.
125% gains in next 4 months are quite obvious.
One may take Swing trading for a week till TP-1 as RSI and KVO both suggests that TP-1 is quite easily possible. Then subsequently TP-2 as well. For TP-3 one may reenter the trade on dip expected after TP-2. However, January is always very bullish and one never knows if TPs are achieved much earlier.
Trade Values
Buy (Mkt): 16.30
TP-1: 18.52
TP-2: 23.06
TP-3: 30.33
TP-4: 36.56

PSO - 17% Quick Gainimmediate entry can be taken with SL around 377 for first TP of 453 and second TP of 491

TPLP Buy Trade PlanTPLP is trading in a bullish penant and has taken support on key fib levels. TPs are 15.45 and below 17


18% gain in GCILThe company has successfully broke out the accumulation zone and now poised to make new HHs and HLs.
Entry can be planned on current rates or post closing 13.86. This will trigger the upside towards 21.4 as per the bullish flag projection while exit as per the trade plan is around 20
SL can be placed at 13.6

Potential 23% upside in PAKOXYThe stock has printed a Bullish Flag Pattern and currently being accumulated.
Breaking 161 on daily time frame will trigger the journey towards the Target Price of 200 with Stop loss of 122
The projection of the bullish flag showing the price to touch 215 easily.

AB=CD Pattern with Bullish Flag: Key Fibonacci Levels in Play!It could be an example of a Bullish Flag.
Why am I posting it?
The reason is to show an example of the AB=CD Pattern, and it currently respected the 61.80% Fibonacci level at 22.17.
If it breaks the 61.80% level on a closing basis (Keeping in mind, it's a Weekly Chart :-) ), it could drop to 18, potentially forming a double bottom. However, if it plays out as expected, the target can be 40+!
Anyhow, I am personally not invested in it—this is just for learning purposes.
