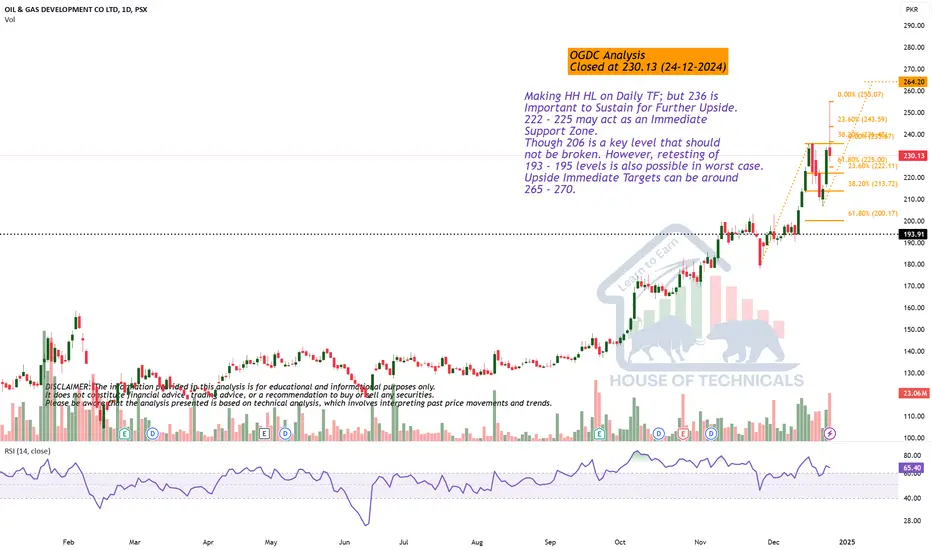
Making HH HL on Daily TF; butMaking HH HL on Daily TF; but 236 is
Important to Sustain for Further Upside.
222 - 225 may act as an Immediate
Support Zone.
Though 206 is a key level that should
not be broken. However, retesting of
193 - 195 levels is also possible in worst case.
Upside Immediate Targets can be around
265 - 270.
Still Bullish on Bigger Time Frames.
Immediate Support seems to be around 92 - 93
which is also 38.20% fib level.
In the worst case, 80 can be tested which seems
bit difficult as of now because of other Bullish
indicators.
Resistance for now is around 99.50 - 100; crossing
it will lead the price towards 110 - 111.

GHNI offering over 30% gains from these levelsthe stock is continuing its uptrend and after making Cup and handle formation, successfully broke out the handle, if it posted daily closing above 444, the stock is likely to test its cup and handle projection of 590 which is a good return of ~32%
with a SL of 360, as per trade plan, entry should be made at 444, with TP1 of Rs. 528 and TP2 of 612, however, as per Cup and Handle projections, one can close the trade around 590 levels.

GATM is BullishPrice has finally given a breakout from a two year accumulation phase indicating the control of bulls. A sustained breakout from the accumulation phase with printing of a higher high is a classic demonstration of bullish reversal as per Dow theory. Targets are mentioned on the chart.

LPGL - PSX - Technical AnalysisOn daily TF, this stock is in Bearish run for quite some time, making LHs and LLs. However, now seeing PSX going into bull run every stock has started to shift its momentum towards bull run.
SHARK harmonic pattern has been drawn (93% compliant). If price follows this pattern then very good return are expected. Price value zone of 170~175 is critical resistance zone, if it is crossed then bull run will likely to follow this pattern. RSI and Stochastic are indicating sufficient space to stay in bullish run. However, be mindful that a limited volumes are traded in this stock.
Trade Values
Buy (CMP): 131.99
TP-1: 165
TP-2: 235
TP-3: 365
TP-4: 440
SL: 100

MTL Broke th Retracement LineMTL is bounced from High 684 into Fibonacci Golden Zone
and expected to go up with first Target 🎯Price can be 684
Stopp Loss should be: 602
Bullish 🐂

BFBIO is flying to 4 figures.BFBIO is going very high since it started This positive momentum may lead it to 365, 640, 910, 1180 and 1430 level.
Note: This is not a buy/sell call. Trade
at your own will. Use stop loss

RCML | Break OutRCML breaks out its consolidation phase, next bullish impulse is expected towards PkR1,000.

PTC for 17% gainsPTC can be traded for over 17% gains. The stock has completed its completed its 38% retracement and now about to make another Higher High
Daily Closing is required above 28.51, thereafter first resistance is 28.88, once the stock sustains above that level. Trade can be entered into with Stop loss level of 23 for a Target Price of 34.08
Crossing 28.51 will trigger the classic ABCD pattern, final projection will be around 34.88 which could be the PRZ

Bullish on Bigger Time Frames.
Immediate Resistance is around 82 - 82.50
Crossing & Sustaining 83 may lead it towards
90 - 91.
On the flip side, 77.50 & 74.50 are immediate
Support levels.
It should not break 69 in worst case; it may reverse
the trend.

Waves Corporation-BuyWaves corporation is making HH and HL. recently it retraces up to 61.8% of fib level, respect ascending trend line, made very bullish candle pattern and also formed Hidden divergence which is indication of continuation of current bullish trend.
with 1:1 risk reward ratio, buy call can be taken

Bullish on All Time Frames.Bullish on All Time Frames.
Weekly Bullish Divergence playing well.
Potential to touch 17 & then 19 - 19.50
However, little Resistance is around 15.50
Good Support is around 12.80 - 13.50

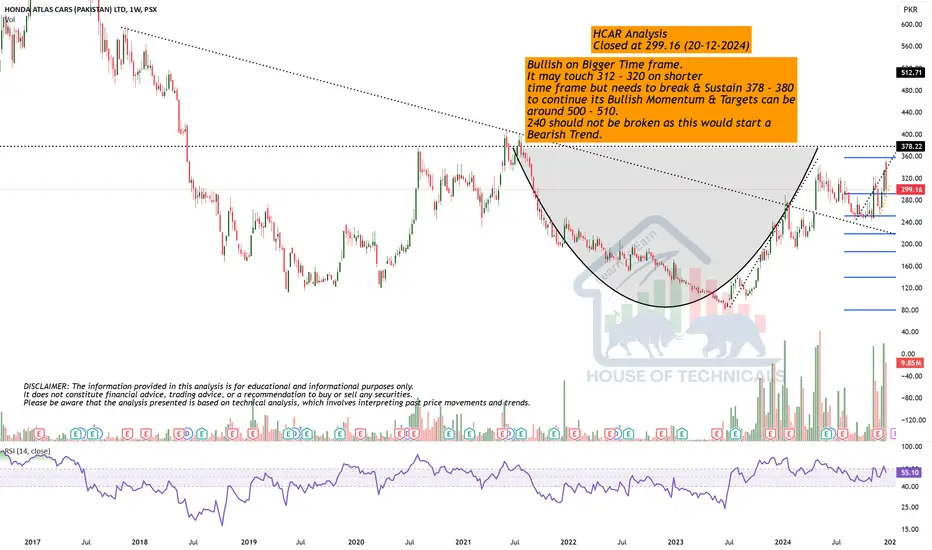
Bullish on Bigger Time frame.Bullish on Bigger Time frame.
It may touch 312 - 320 on shorter
time frame but needs to break & Sustain 378 - 380
to continue its Bullish Momentum & Targets can be
around 500 - 510.
240 should not be broken as this would start a
Bearish Trend.
TRG is BullishPrice was in a strong downtrend, respecting the descending trendline, however a matured bullish divergence on daily time frame suggests that bulls are trying to assume control of the price action. Now it seems that the descending trendline would be broken by bullish momentum which would potentially lead of a bullish reversal as per Dow theory. Targets are mentioned on the chart.


CSAP is heading to 131 againCSAP is dropped from its strong support of 101 and not touched to support of 93.82, fresh entry could be taken if it crosses 101 again or it drops to 93.82 and bounce back. Stop loss 93 and 83 TP 1 is 108, TP 2 is 117 and TP 3 is 131
Note: This is not a buy/sell call. It is an analysis. Trade at your
own will.

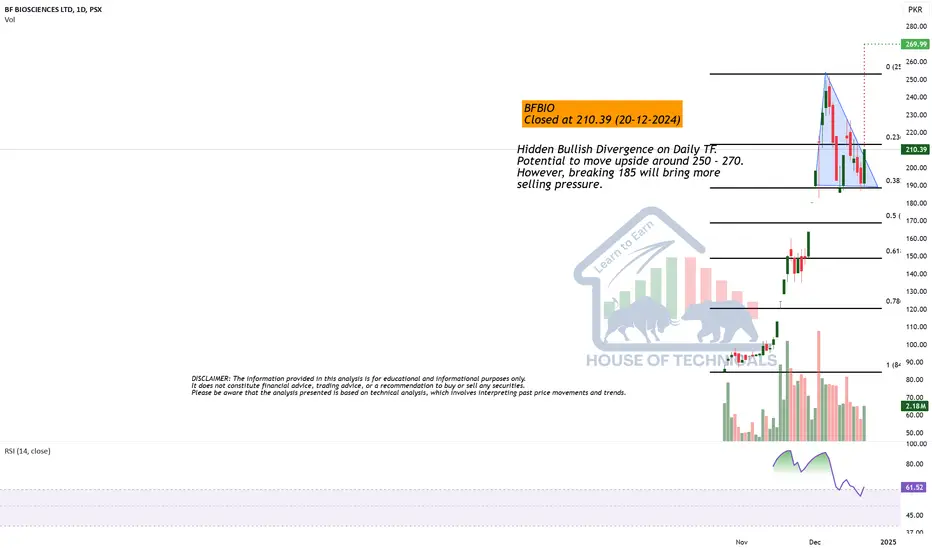
More Potential...Hidden Bullish Divergence on Daily TF.
Potential to move upside around 250 - 270.
However, breaking 185 will bring more
selling pressure.
OGDCOGDC making HHs and HLs, initial resistance lies around 236 which consider the initial target and upon break out next resistance lies around 280.

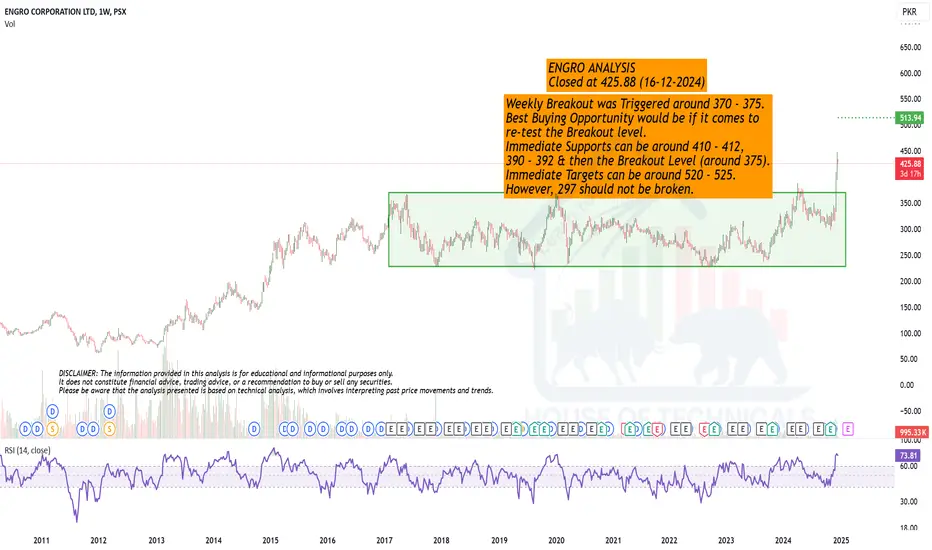
Breakout retest possible...Weekly Breakout was Triggered around 370 - 375.
Best Buying Opportunity would be if it comes to
re-test the Breakout level.
Immediate Supports can be around 410 - 412,
390 - 392 & then the Breakout Level (around 375).
Immediate Targets can be around 520 - 525.
However, 297 should not be broken.
OBOY looks good to buyBuying in OBOY could be possible if it maintains support of 10.5, Stop loss is 9.4 and TP is 11.7 and 13.75, In long term investment it could cross 100 level.
Note: This is not a buy/sell call, trade at your own
will.

Refrain from trading in HINOAfter making Bearish divergence on daily time frame. the stock is likely to restest its breakout trendline and hopefully consolidate in 336-340 range for another bull ride.

SYS - PSX - Technical AnalysisOn daily time frame, price after defining a Higher Low of bull cycle is going up. A hidden bullish divergence has also played indicting that trend will continue. KVO also suggest that bull run is still on. TPs have been set using Fib.
Trade Value:
Buy CMP: 599.78
TP1: 679
TP2: 716
SL: 520

ImageImage breaking out to all time highs. Leading the way as other big textile companies are yet to breakout.
