KELAB=CD pattren play beark B point and retracment complete at fib level 0.50%
buy 5.32
SL 3.53
TP 8.07

Making HH HL on Daily TF.
38.30 can be an Immediate Support level.
However, 35 - 37 is still an Important Support zone.
On the flip side, 41 - 42 is the immediate
Resistance. Ultimate Targets can be around 50.
30 should not be broken, otherwise we may
witness Trend Reversal.

SpelAnother cyclical stocks to benefit from lower interest rates. Retraced perfectly from all time highs.
It's in a good risk to reward position


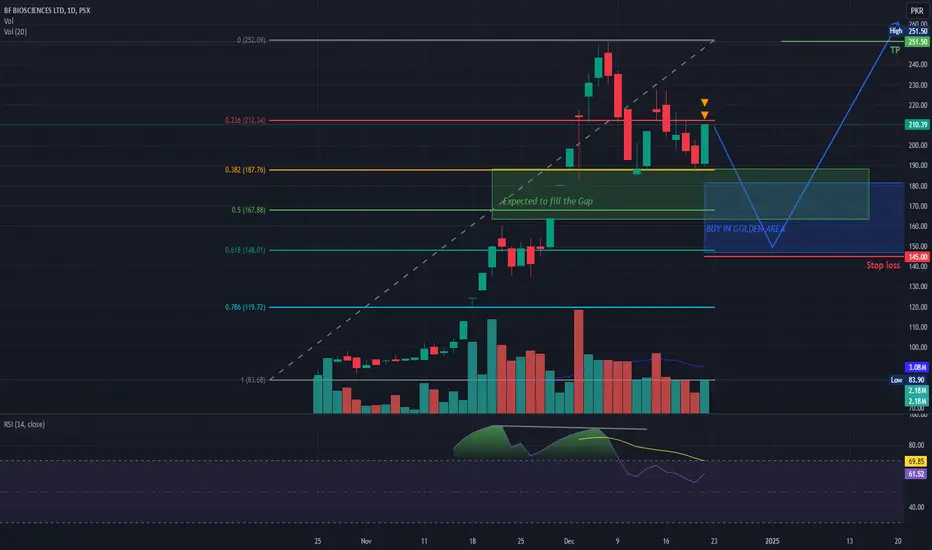
The BFBIO (BF Biosciences Limited) 1-day chart on the PSXKey Levels
Buy : Enter the trade if the price moves to fib levels between 167 to 148.
Stop Loss: Set at 145 to minimize potential losses if the pattern fails.
Take Profit (TP) Levels: 251.50 (All-time high)
Trading Strategy
Entry: Buy when the price (around 165 to 148).
Stop Loss: Place a stop loss at 145 to protect against potential downside.
Take Profit: Set a take profit level at 251.50 to capture potential gains.
Beautiful Bullish Engulfer on Daily TF.Beautiful Bullish Engulfer on Daily TF.
61.8% fib retracement done around 90.50 - 91
Stock is Still Bullish on Bigger Time Frames.
If 96 is Sustained, we may easily wintess an
upside around 103 - 105 initially.


SNGP BullishSNGP bounced back from Golden Zone 92.22 and expected to go up and its first target is 110

POl Bullish In PSX POL ( Pakistan Oilfields Limited) iss touching and closing above trendline.
Wee are still bullish in this scrip with first target of 699.
Even though its Quarterly result was not up to the mark but it is still very strong scrip.
Bullish.

APL Bullish APL bounced from Golden Zone 486
First Target can be 568 if it breaks the Retracement Orange Line.


ATRL: First Target: 900ATRL: First Target: 900
TP2: 1134
ATRL boucned back from Golden Zone and stayed there and closed at 694.
First Resistance :
is 788. If it breaks and close above then it might go to 900 Fist TP

AICL, Weekly Resistance BrokenBullish Triangle Breakout
projected target complete
weekly resistance broken
resistance retest expected
consolidation and new highs expected

Sazew intra day and Swing trade levels.Sazew intra day and swing trade model
These are key levels 1273, 1191, 1141, 1101, 1061, 1004 and 930
When price crosses above from these levels take a trade and TP will be next level and TP 2 will be next to next level. Stop loss is below level. For example it is currently on 1081 so, we have to wait for next level of 1101 for buy entry, TP 1 will be
1141 and TP 2 is 1191 and stop loss is 1061.
Note: This is not a buy/sell call. Trade at your own will.

Wavesapp is flying to 19 level.Wavesapp dropped and near to its support of 9.46. Fresh entry is possible if it dropped to 9.46 and bounce back or it crosses above 11.46 level. TP 1 is 12.87 TP 2 is 14.25 TP 3
is 16 and TP 4 is 18.8. Stop loss 9.46 and 6.9
Note: This is not a buy/sell call. Trade at your own will.

EFERT is heading to 215 againEFERT is dropped from its support of 192.5 and again bounce back and cross above 192.5 level. Fresh entry could be possible and it is likely to cross 201 and 215 again. TP 1 is 201 TP 2 is 215. Stop Loss 185.
Note: This is not a buy/sell call. Trade at your own will.

SLGL fresh entry levels.SLGL is dropped from its support level of 15.75 and it is heading to its support level of 14.33.
Fresh entry could be take after breaking again 15.75 or dropping below to 14.33 and again cross above 14.33
Use stop loss at 14.33 and 12.8
TP 1 is 17.5 and TP 2 is 20.4
Note: This is not a buy/sell call. It is an analysis, trade at your own will.

Mari is heading to 900 againMari did not drop more to below its support of 594. it dropped from its support of 666 and bounce back again and broken resistance of 666 and touched 715. It is likely to cross again 755 and heading to 900 again. Use stop loss below 666
Note: This is not a buy/sell call. Trade at your own
will.

PSX - KSE100 - HINO - end of bullish trend?HINO has successfully broken out of both the falling trendline and an accumulation box, signaling a bullish trend. Currently, the price has tested the Fibonacci golden pocket and formed a hammer candle, which is a bullish indicator.
Trading Plan:
Buy Opportunity:
Entry: Current price
Stop Loss: Below the hammer candle low at 380
Targets:
TP1: 490
TP2: 525
Re-entry Plan (if Stop Loss is Hit):
Entry Zone: 360-325
Stop Loss: Below 310

GGGL-LONGGGGL has started a bullish trend as price has broke a consolidation box and now making Higher HIghs and Higher lows,so take a long entry at CMP

DGKC-LONGDGKC is trading in a bullish trend and now price has started reversal after correction so we will take long entry at CMP
