ATRL for 22% quick gainATRL should be considered to trade. Buying can be made around 776 for first TP of 863 and 2nd TP of 950.
This will be quick gain of 22% with SL of 689

WAHN - PSX - LONG SWING Trade OpportunityFundamentally company is growing as it is producing chemicals used in ammo manufacturing of POFs; besides it is Commercial Selling front-end of POFs products. Backing by Min of Defence Production is another plus; therefore, no shortage of Cash Flow (despite what their Financial Statement says). On going war in Europ is very beneficial for this company as it has huge number of orders pre-hand. Last year company gave huge dividends and once again it has given 100% dividend as well due in Oct 2024.
Technically, on Monthly TF Cup & handle formation is in making which indicates a bull run condition. The Bull run on Daily TF has also begun. On Daily TF AB=CD pattern has been drawn for taking quick profits in a couple of weeks. Therefore, instant Buy at around 220 can be initiated and TP be set at around Rs 270 ~ 280. However, it is expected that it should be reaching previous all-time high of Rs 369 by May~Jun 2025. One can book profit at that time and re-enter in Buying once price drops to Fib 0.382 level on Monthly TF (Rs 280.91). Then next Bull run is expected to take its price to Rs 600 by end Sep 2026.
Disclaimer : This is not a financial advice; it is being shared for the education purposes only. Take trade as per your own analysis.

GGL - PSX - Technical AnalysisOn daily TF, GGL is following the bullish parallel channel. Price is almost at the bottom support of the channel with 45% Fib retracement. Therefore, one can enter the trade at this time.
Trade Values:
Buy1: 13.95 (Current Market Price)
Buy2: 13.55
SL: 13.50
TP-1: 18.27
TP-2: 19.95

RPL - PSX - Technical AnalysisRPL is following Bat Pattern. If it continues to follow it (91% chances) then it is going to test 15.80 first and then will test 15.00 and then 13.20 and eventually 10.75 .
And if it does not then it will bounce back from Orange line which is weekly support line.


ASC seems good in a bulish flag pattern it will hits the target it is not buy sell call its idea i m looking its will achieve its target in coming days.

MARI - PSX - Technical AnalysisOn daily TF, MARI has defined a Higher High and has came down to define a Higher Low.
Currently almost 52% Fib retracement (Rs 655) has done. Price may even further drop to Fib 61.80% (Rs 610). Now, this is the golden pocket (50~61.80%) retracement zone, where most financial institutions prefer to enter.
Trade Values
Buy-1 (CMP) : 660
BUY-2: 635
SL: 550
TP-1: 895 (Just before previous ATH)
TP-2: 1105

MARI PETROLEUM - LONGMany people are concerned about MARI, but I believe it will recover around the 30-minute EMA, approximately 650-660. After a brief consolidation, the next move upward may follow. The chart outlines the target levels.


SYM is expected to cross 82 level in next 06 to 24 months.SYM consistency showing positive growth and it is expected to cross 20 level soon and then 35, 51, 67 and 82 in next 12 to 24 months
Note: This is not a buy/sell call.
Use stop loss.

POL with 14% gains Entry can be taken when the price sustains above 698 of the curve formation projections of which will raise to the Target of 850+ which would be the gain of 21%+
Planned entry: 698
Target Price is around 846
Stop Loss 549

AIRLINK offers 40% gain in till the final projectionThe stock has comfortably consolidated and has broken its last LH @ 149.5, crossing that will trigger the potential capital upside of 40%.
There is a bullish flag pattern being posted by the stock and further confirmed when the bullish flag pole is crossed around 152 level.
Instant entry can be made here with the first TP of 179.8 and second TP of 210. Final projections of the bullish flag is 220

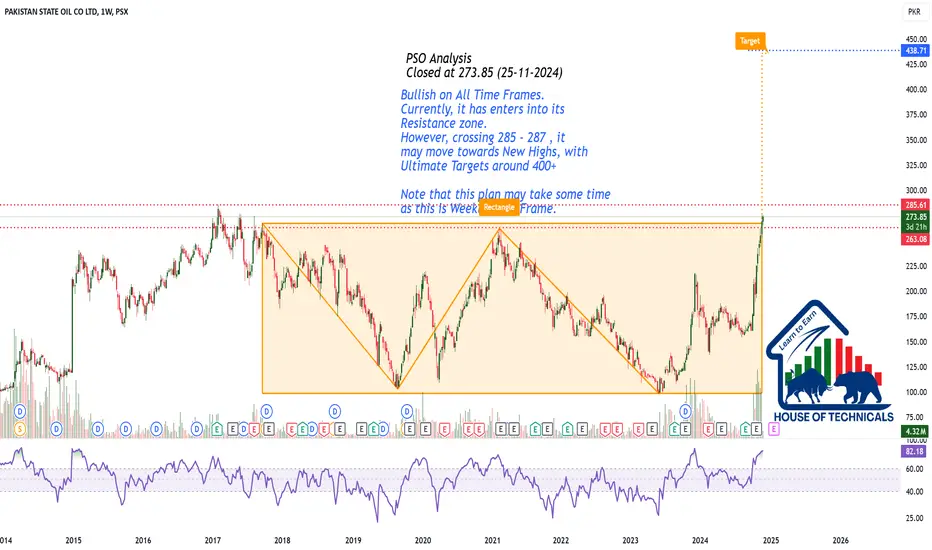
Bullish on All Time Frames.Bullish on All Time Frames.
Currently, it has enters into its
Resistance zone.
However, crossing 285 - 287 , it
may move towards New Highs, with
Ultimate Targets around 400+
Note that this plan may take some time
as this is Weekly Time Frame.
Still Bullish335 - 350 is an Important Resistance zone.
Stock is still Bullish on All Time Frames.
It still has the potential to go upside.
Crossing & Sustaining this level may lead
it towards 400 & then around 450+.
On the flip side, Immediate Support is bit away
around 280 - 285.

INTERLOOP BULLISH FLAG PATTERN The script of Interloop (ILP) seems to continue the Bullish Trend as Bullish Divergence is seen on the charts and the price is bouncing from the 0.618 FIB level making Bullish Flag Pattern.
The target price for the Script is around Rs. 149 with major support at Rs. 85.
What are your Views ????????

HUBC offers 35% gainTrade can be entered at 158 by placing SL @ 103 for a TP of 213.
The stock went into bearish trend as soon it broke out the HL around 141, thereafter it consistently posted new LHs and LLs. However, RSI made double bottom instead of making LLs, which indicated the potential reversal of trend.
If 158 being its LH is broken, the stock will be ready to again making new HHs and HLs.

HUBC offers over 60% gain within next 12 monthsLong term Investors or long term swing traders should enter the stock's trade.
Cup and Handle formation on the monthly chart is in making
Monthly closing above 140.41 will expose the stock to post Historical Highest price around 224
SL should be placed below 93
TP1 could be placed at 189 by entering the trade at 141 while TP2 could be set at 237, while as per projections, Trade could be closed at 224

ILP can be traded for 60% potential gainsILP trade can be entered into at a price above 85.5 with a SL of 60.5
First TP will be 110.5 while second TP would be 135.5, Final Projection of the Bullish pennant around is Rs. 140, a good company with solid capital potential on the cards.

PAEL can double your savings within 2-3 yearsThe stock after 5 years of making its historical high has finally broke out its last LH which is 37.6.
If the Dec'24 closing of the stock is above 37.6, then it can give you 2.5-3x returns i.e. triple your earnings within next 2-3 years.
TP1 is 40% above the current price, TP2 is approximately 53% higher than the current price
TP3 will provide you over 100% returns and this can be achieved within 1 year.
This trade is for Investors who can hold the investments for atleast 2-3 years.

Still BullishAs stated in last analysis (on 03-12-2024)
that it can easily touch 35-36, and it did.
Now it should retrace till 32.50 - 32.80 &
then move upside towards 40 - 42 & even
47.
However, if 36.60 - 37 is Crosses & Sustained,
we may witness 45 - 47 soon. Inshaa ALLAH

WAVESAPP is potentially exposing 67% gain from these levelsRisk takers can enter the trade instantly with SL around 7.23
Perfect entry is made around 14.36 being the breakout of Last HH, breaking that level will trigger the trajectory towards final projection of the ABCD pattern.

MARI - Technical AnalysisMARI is in bull run as ever. RSI and KVO also suggesting strong buying.
Fundamentally very strong and now showing its true potential. New entrants may buy now or wait for the dip expected shortly but that would be very brief.
Trade Values
Buy : 558
SL: 429
TP-1: 604
TP-2: 731
TP-3: 797

World Call posing 46% Capital upside The stock has broken its last LH @ 1.65 on weekly basis, one should keep the stock in its monitoring list for the breakout of 2.08 for atleast 46% upside for the projection target of 3.03, Exit can be made around 2.95-3 for solidifying gains.
