SAZEW Simple Box Trade PlanSazew is consolidating itself in a well define box which may give a breakout for a next bull move. Buy stop should be made if it successfully breaks the box on closing basis


PSX - SPELSPEL is close to break out with Good Volume.
Trade Plan:
Entry: CMP 45.22
TP1: 56.87
SL: 31.5
Influenced by B&B Show

PSX - PAELPAEL has broke accumulation box and cureently testing .38 level on retracement
Trade Plan:
Entry: CMP - 33.42
TP1: 36.75
TP2: 39.9
SL: 29

THCCL is heading to 530Positive momentum of THCCL shows a robust growth and it is near its new resistance level of 245 and this positive momentum may be lead it to
530 level by July 2025
Note: This is not a buy/sell
call, trade at your own will. Use stop loss.

TOMCL is ready to flyTOMCL is ready to breaking its resistance and it will again cross level of 40, 43, 45 and 47
May be this time it could cross level of 50 too. Use stop loss below line of the triangle
TP is 40, 43, 45, 47 and 50. Note This is not a buy/sell call trade at your own will.

SMCPL is ready to flySMCPL is in sideways and maintaining support but not breaking resistance. This green triangle is its resistance and if it could break it than fresh entry is possible. Use stop loss at below line of the triangle. TP is 27 and 30. Note: This is not a buy/sell call. Trade at your own will.

Loads could rise 65% Loads is maintaining its support level of 14.5 and it is heading to resistance of 18.3 than 22 and 25.7
Positive momentum of its hows it could cross 22 and 25 levels. As per current price 15.55 it is gain of 41.5% and 65%
Stop loss is at 14.2
Note: This is not a buy/sell call. Trade at your own will

TOMCL-Buy CallAfter posting recent High of 46.6, it retraced upto Fib level of 50%.
Bullish Divergence on RSI,
Breakout of Bullish Flag with relatively Good volume
Bulls are expected to gain strength
With very strict SL, nice Risk to reward ratio expected.
One can get immediate target of TP-1, then TP-2 (Previous High) and TP-3 (Bullish flag Projection level)

HCAR has a potential to post 160% gain within next 12 monthsCritical point to watch is Rs. 410 which was a monthly LH, Monthly closing above 410 will trigger the journey towards the historical HH of 928, however, as per falling wedge pattern, the projected price would be around 848 which is a 166% gain from these levels. However, Stop loss should be placed at 243

TOMCL taking off for 65% potential gains within next 3 monthsThe stock has recently made a divergence breaking 38.5 will trigger upside journey, however, keeping the SL at 31.7 , one can enter the trade with first TP of 45.6 which will be a gain of 18%.
The second TP of the trade is Rs. 52.65 (total gain from entry point will be 36.7%), however, it will be confirmed once HH of 47.7 is break out
If the HH is broken out, the final Target as per AB=CD pattern would be 61 which is around 58% upside from the entry price and ~65% if the trade is taken immediately with SL of 31.7


CPHL will be double in value soon. Positive momentum and maintaining
support of 62 today, It is likely to cross 81.25, 100 and 120 levels.
I think it could cross 120 level in
January of February 2025.
Note: this is not a buy/sell call
Use stop loss whenever trade.

TRG Ready for another 16% rideThe stock after breakout its bearish cycle, continuing its bullish ride, recently retraced to mark its LH @ 54 which will be out SL for the trade.
Enter at the breakout of symmetrical triangle at a price of 64.35 for the target price of 74.7 which will be out first TP, approximately 16% gains

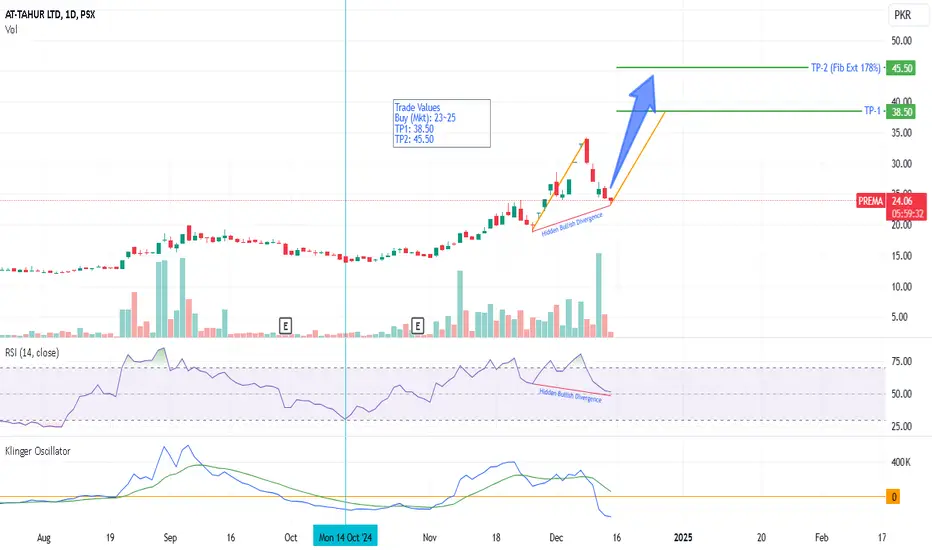
PREMA - PSX- Technical Analysis - BUY CallOn Daily time frame, PREMA after making sharp gains has retraced to more than 60% becoming very attractive for Buyers.
KVO has also started to change its direction upwards indication a shift of momentum coming up. On RSI, there is a Hidden Bullish Divergence in the making which indicates a very sharp up trend coming up. Therefore, buying immediately at market price will yield substantial gains in quick time.
My Trade Values :-
Buy (Mkt): 23.50 ~ 25.00
TP1: 38.50
TP2: 45.50
TRG gaining Bullish TrendButterfly Harmonic patter visible,
with bullish divergence. Broken its last LH
High chances of a bull rally.

CPHL - PSX - Technical AnalysisCiti Pharma is in bull run for almost past 9 months. On Monthly TF, Cup has been formed but Handle is yet to be made. See picture pasted on the chart. For that price must retrace a bit to Fib 0.23 to 0.38. In that case Entry will be at retrace and TP will be equal to depth of the cup.
On the other hand if price does not retrace then entry should be sufficiently above the Daily Resistance level so that it then becomes its support level.
RSI and KVO both are supporting the bull run continuation.
Trade Values
BUY-1: 53
BUY-2: 42
TP: 81
SL : 38 (HL)

Still Bullish...but...Currently at Resistance level around
127 - 129.
The Stock is still Bullish & has the potential
to move upside.
However, some retracement till 109 - 111 is
expected.
& then if 129 - 130 is Crossed with Good Volumes,
we may witness 150 - 170.

Image-Buyin entire 2024, Image traded in consolidation box. at the same time a cup & handle pattern also appeared on the chart. Now recently, it gave breakout of consolidation Box and cup & handle pattern with excessive volumes which shows strength of Bulls.
Buy at current Price
Target Price: Projection of Consolidation Box and Cup & Handle Pattern
SL: last LL.


SPEL offers 78% upside from these levels50% of the planned quantity should be entered at Rs. 45.26 with SL of 31. Remaining 50% quantity can be added once pole is breakout @ 80.72 which is a 78% capital upside.
The stock has retraced to 0.618 level @ 31 which is the HL, now the stock is ready to define its HH that potentially be the flag pole projection being out ultimate Target

GATM Offers 30% upside on weekly chartAfter achieving TP1 of 25.05 and TP2 of 26.69, GATM is poised to make another stream of gains. This time 30% upside, if weekly closing is above previous High of 26.81, with SL @17.4 for Potential Target price of 35.71.
Since the trade is on weekly chart, it can simply take 2-3 months to achieve the Target.

AIRLINK - PSX - Technical AnalysisThe SCRIPT has recovered from the impact of the share selling by its Director and now showing bullish trend.
RSI is indicating bulls control after retrace. KVO also suggests Buyers in control taking prices up.
AB=CD pattern has been drawn to identify the TP.
Trade Values
Buy-1: 177.69 (If dips)
Buy-2: 210 (on crossing previous HH)
Buy-3 (Mkt): 192 (risky as it may retrace to test again Fib 0.38 or even Fib 0.50)
TP: 262
SL : 150
