BBFL Stock Reversal: From Consolidation to Breakout RallyThe chart for Big Bird Foods Limited (PSX: BBFL) illustrates a classic market cycle with a notable reversal pattern. Initially, the stock experienced a prolonged downtrend, forming a rounded bottom between late 2024 and early 2025. This was followed by a range-bound consolidation phase, indicating accumulation by market participants. Around May 2025, a bullish breakout occurred, pushing the price above the resistance zone and confirming the reversal. Since then, the stock has shown a strong uptrend with higher highs and higher lows, supported by an upward-sloping curve, suggesting increasing momentum. The shaded projection area indicates a potential bullish continuation, with price targets potentially reaching above PKR 87 if the trend holds. Key support lies around PKR 44–49, which would be crucial for trend sustainability in case of a pullback.

BOP Trade SetupThe stock has recently corrected towards its 200-day EMA, currently positioned at PKR 8.99, and has shown signs of stabilizing near this key long-term support level. Historically, the 200 EMA often acts as a strong bounce zone, especially in stocks that have previously demonstrated bullish momentum.
The recent downtrend appears to be losing strength, with declining red volume indicating possible seller exhaustion. A rebound from current levels could signal a short-term trend reversal, offering a favorable risk-reward setup for swing traders.
With moderate volume support and price action indicating potential consolidation, BOP presents a compelling opportunity for investors looking to enter near support with clearly defined risk parameters.

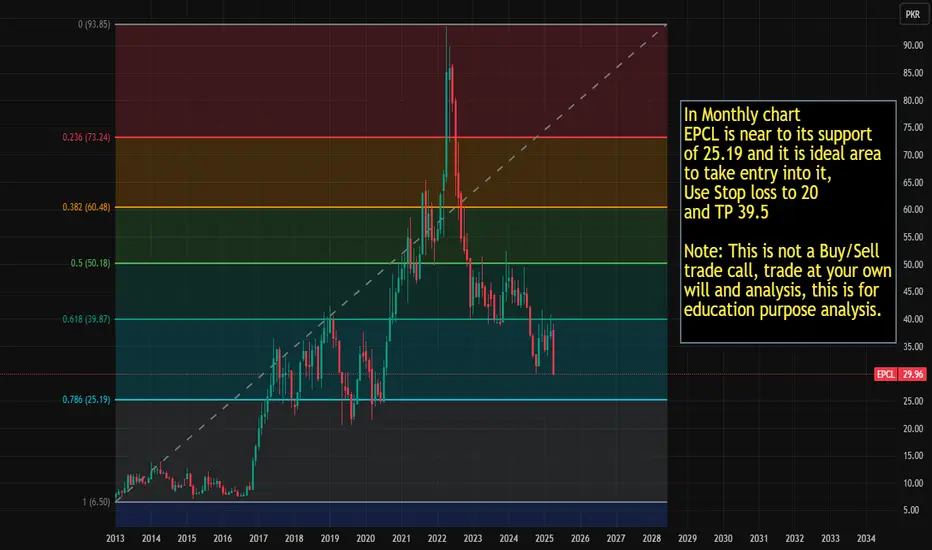
EPCL is in ideal range for entry. In Monthly chart EPCL is near to its support of 25.19 and it is ideal area
to take entry into it, Use Stop loss to 20 and TP 39.5
Note: This is not a Buy/Sell trade call, trade at your own will and analysis, this is for education purpose analysis.
SSGC | Downward-Sloping ChannelThe stock in a downward-sloping channel after a strong rally that peaked near PKR 50.87. Currently trading at PKR 39, the price is above the 200 EMA level (28.70 PKR), suggesting longer-term bullish strength despite short-term weakness. Recent price action faced resistance near the upper trendline, and today's bearish candle indicates selling pressure. Key support lies around 37.00–35.00 PKR, while a breakout above 41.00–43.00 PKR could signal a resumption of the uptrend if backed by strong volume.

GHNI BUY IDEA.AS per the Elliot wave theory we are in the 5th leg which is targeting 950 rs.
As of the current scenario , we are trading in a bullish parrallel channel.
with Hidden divergence formed + emas merging on this point we can expect a good bull move from 710-720 rs , targeting abv highs.
A bullish candle will be very good.

Live Buying Signal in SymLive Khareedo (Buy) signal in Sym at 14.9. Lets see how long it will go.
Note: This is not a buy/sell trade call. Trade at your own will. Use stop loss.

Live buying Signal in FCCLLive buying Signal Khareedo (Buy) in FCCL at 44.9. Lets see how long it will go.
Note: This is not a buy/sell call, Trade at your own will. Use stop loss.

Live Buying Signal in Airlink This is live Khareedo (Buy) signal in Airlink at 168.99, Lets see how long it will go.
Note: This is not a buy/sell call, Trade at your own analysis and will. Use stop loss too.

Live Buying Signal in EfertOur Custom indicator Signals Wala Jin generated live Khareedo (Buy) signal in Efert at 175.45. Lets see how long it will go up.
Note: This is not a buy sell trade call, trade at your own will and analysis. Use stop loss.

GAL (Ghandhara Automobiles) – Bullish Setup EmergingGAL (Ghandhara Automobiles) – Bullish Setup Emerging;
LDCP: 472.83
Ghandhara Automobiles (GAL) is respecting its rising channel beautifully. A Bullish Doji Star has appeared near the lower boundary of the channel, signaling a potential reversal. The Stochastic RSI is extremely oversold (below 10), strengthening the case for a rebound.
As long as GAL holds above 460–462, a bounce toward *** and *** remains likely. A daily close below *** would negate the bullish bias.

BiplVery difficult to break down from this consolidation during middle of a bull market. It is giving very good risk to reward ratio

GHNI Next BULLISH MOVEHistorical Trend: Strong bullish momentum observed.
Current Situation: Price dropped after a clear bearish divergence signal.
Stock Status: Still in an overall bullish structure.
Next Step: Divergence has already occurred ....... preparing to ride the next bullish move.

GLAXO-1H (PSX) – Bullish Reversal; Targeting: 435 - 475📊 GLAXO-1H (PSX) – Short-Term Analysis; Targeting: 435 - 475
CMP: 410
GlaxoSmithKline Pakistan Limited (GLAXO) is currently trading within a critical Golden Pocket Zone, between the 50% and 61.8% Fibonacci retracement levels, around 423.69 to 411.50. This zone often acts as a strong support area where price reversals are highly probable. The Stochastic RSI is deeply oversold, indicating that selling pressure may be exhausting and a potential bounce could be near. Price action is stabilizing around 410, suggesting short-term support. As long as GLAXO holds above 410, there is a good chance for a rebound toward 423–425 initially, and further upside toward 435–445 & 461 - 475 if momentum builds . However, a breakdown below 400 would weaken the bullish setup and open room for more downside. Cautious optimism is advised while monitoring for confirmation signals above 415.

PSX: ISL OutlookISL is taking support from weekly channel for new bullish trend. Expecting positive monthly closing
Entry: CMP
SL: 160
TP1: 86
TP2: 102
TP3:128
harmonic pattern TP 160 Level

Bearish Divergence has appeared.Bearish Divergence has appeared.
Immediate Support lies around
203 - 208
Next Support lies around 178 - 188
Bullish Momentum will resume once
it will cross 222.

Breakout re-tested.Breakout re-tested.
Morning Star formation.
The only concerning thing is Bearish
Divergence appearing on Weekly TF.
Crossing & Sustaining 140 may lead it
towards 160.
However, breaking 120 may bring further
selling pressure.

FFC entered into bullish zoneYesterday before closing our custom indicator named SignalsWalaJin generated signal "Khareedo" means buy @358 and it was at 361 at closing. Lets see how much it will rise.
Note: This is not a buy sell trade call. Trade at your own will and use stop loss.

PSO SHORT TRADEPSO failed to post a Higher High in its effort in March 2025
It has broken down its Upward Trendline with heavy volumes
It is expected to continue downward at least till its next support at 325
Short Sell PSO 370-360
TP 325
SL 381

CNERGY SHORT TRADECNERGY has recently broken down of its upward trend line after encountering Bearish Breaker Block
It is expected to continue its new downtrend
Short CNERGY 7.8-8.1
TP 6.8
SL 8.9

BOP SHORT TRADEBOP has recently broken its upward trendline with heavy volumes
Short sell BOP 9.7-10.7
TP1 8.8
TP2 7.8
SL 11.1

HUMNL SHORT TRADEHUMNL gave Shortening of Thrush and a Lower High in Dec 2024 and Jan 2025.
It has now broken out of its Upward Channel
Short Sell HUMNL 12-12.7
TP1 10.5
TP2 9.5
SL 13.8

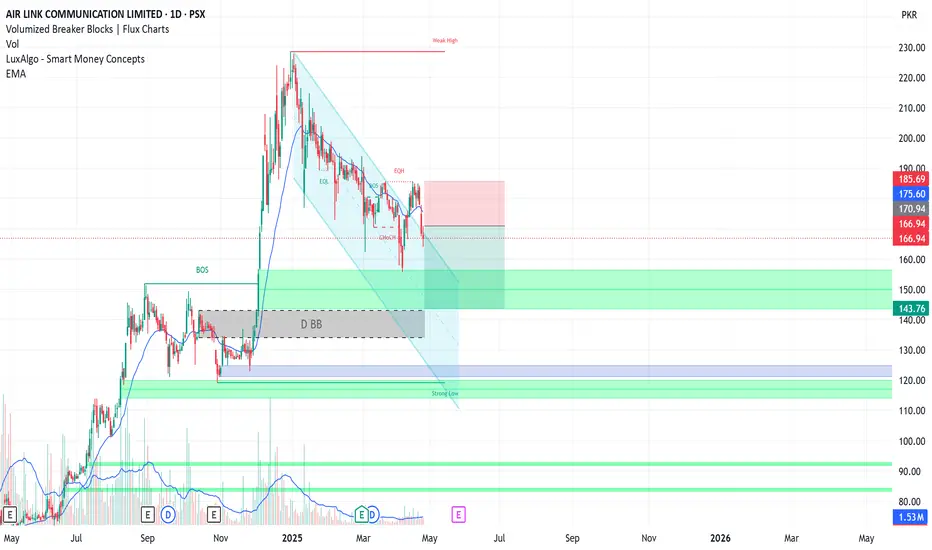
SHORT SELL AIRLINKAIRLINK is in Downtrend since January 2025.
It has recently tried to Breakout of the downward channel but failed to post a higher high
It has created a double top instead
Short Airlink 166-177
TP1 156
TP2 143
SL 186
GAL SHORT TRADEGAL has recently broken down its upward Trendline and posted a Lower Highafter giving Shortening of Thrust
Short Sell GAL 470-490
TP 422
SL 510
