Beautiful Bullish Flag (M) Eying BreakoutA beautiful bullish flag has formed on the monthly charts, with projections around 56 . However, there is strong resistance around 48 , which could be a good point to offload a small portion and consider rebuying after a pullback or once the resistance is cleared. The exact target of the projections will depend on the value where the breakout occurs, so adjust your strategy accordingly!
Note: Always consider your own research and risk management before making any decisions.

Long - Lucky CementCup and handle pattern formation.
Daily Break out confirmed.
Retesting possible at break out level tp confirm long bullish momentum
Targets 1200 , 1310, 1550

Airlink LongCurrently in a consolidation phase wait for break out and than you can enter. I hae not given any targets. You can do your work, and it will be great learning. I think it has the potential to give massive gains.

Tele - long positionsI have personally entered into Tele considering EMA 200 break out. Hopefully will be done today. Monthly trendline break out (hopefully it will survive). I belive 9.5 is first target. 2nd target is 11. This has potential to double itself in long term.

HALEON PSX - LONG (Buy) Trade Call - Daily TFTechnical Analysis:
On Daily TF, price is well above EMA 89 and just above EMA 21. It indicates bull run and ideal time for Buy entry. Parallel channel has also been drawn and price has taken a support from lower line of channel as well. It may not slip any further and may go upwards from here onwards. HOWEVER,
Klinger Oscillator, on the other hand, has dipped below Zero level and in nosedive position. Moreover, RSI indicator shows a bearish divergence formed on Wednesday (2 days ago) - indicating a likely trend reversal after which a dip in price is seen.
Scenario 1: Therefore, if price goes up beyond 615 on 28-10-2024 at 10:00 ~ 10:15 am, one may buy.
Scenario 2: On the other hand, if price goes downwards then it is likely to test Fib retracement till Fib 0.68 level. One must take entry then. Fib Extension tool defines the TPs as mentioned below:-
Buy Trade Call Scenario 1:
Entry (BUY): 615
SL: 585
TP1: 778
TP2: 834
TP3: 915
Buy Trade Call Scenario 2:
Entry: 518 with Stop Loss value at Risk of 2%.
TP1 :650.
Remaining TPs can be kept similar.

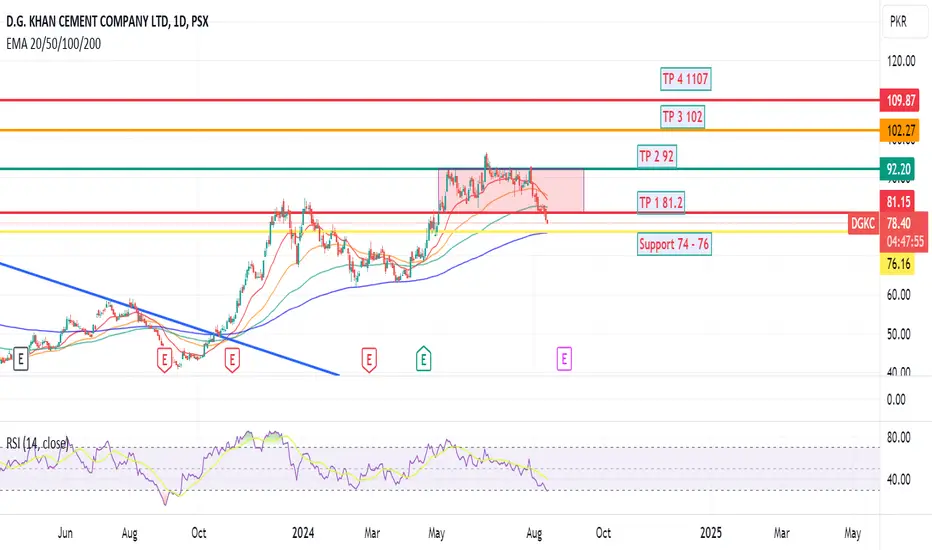
DGKC ready for long positionDGKC is taking continuous support from daily EMA 200.
RSI is around 30 so ready to make a move.
TPs and support is showing in the chart
BUXL Offering 35-40% Capital upside from these levelsBUXL if give day's closing above 217 it will be marching towards 306 which is the final projection of the bullish Flag.
However, owing to the current market situation, it will be wise to put your SL in place which is 150.23, Instant Entry can be taken here with first TP at 283 and second TP of 349, however, bear in mind that as per final projections of the Bullish Flag, it will be wise to close your trades @ 300-306 levels
Buying on these levels provide an opportunity for 35-40% capital upside

Sazgar Engineering Works Limited 1D PSX Chart - Cup & HandleThe Sazgar Engineering Works Limited (SAZEW) 1-day chart on the Pakistan Stock Exchange (PSX) shows a Cup & Handle pattern, which is a bullish continuation pattern. Here's a detailed description:
Pattern Description
- Cup: The pattern starts with a rounded bottom, resembling a "U" shape, indicating a period of consolidation after a prior uptrend.
- Handle: Following the cup, there's a slight downward drift or consolidation, forming the handle. This handle should not break below the support level of the cup's low.
Key Levels
- Stop Loss: Set at 1000 to minimize potential losses if the pattern fails.
- Buy Over: Enter the trade if the price moves above 1100.
- Take Profit (TP) Levels:
- TP1: 1225
-TP2: 1330
Trading Strategy
1. Entry: Buy when the price breaks above the handle's peak (around 1100).
2. Stop Loss: Place a stop loss at 1000 to protect against potential downside.
3. Take Profit: Set two take profit levels at 1225 and 1330 to capture potential gains.
Pattern Validation
- Volume: Look for an increase in trading volume during the breakout above 1100, confirming the pattern.
- Confirmation: The pattern is confirmed if the price continues to rise after the breakout, ideally reaching TP1 and TP2.

Is the Dow Theory Still in Play?First of all what is Dow Theory?
According to Dow Theory, it's all about Higher Highs (HH) and Higher Lows (HL) or Lower Highs (LH) & Lower Lows (LL). These the building blocks of an uptrend or downtrend respectively: (You can further google it) Together, a series of HHs and HLs suggests that the market's upward momentum is intact.
Now Let’s take a look at the weekly chart:
Previously, The market was locked in a downtrend, consistently making Lower Lows and Lower Highs. But the pattern broke when the price could not broke the previous low (LL) of 14.42 (closing basis) and formed a new high at 19.45 (Breached Previous HL). Since then, the sequence of HHs and HLs started, with the latest Higher Low at 24.36. As long as the price respects this pattern, the uptrend remains intact.
However, there are challenges ahead. Athough, the EMA 89 (Fib) is offering support on the weekly chart, but a significant trendline resistance is there on both the weekly and monthly timeframes (marked in red) which is lower there on the graph from the previous HH. Breaking this resistance and the previous Higher High (HH) will be a little bit crucial, but a retest of the trendline may occur if the breakout is successful.
Note: I’m also a learner and open to suggestions. If you spot any errors or gaps in my analysis, feel free to share your thoughts. Thanks!

Eyeing breakout levelThe price action has formed a bullish flag pattern (Weekly), with the current levels reaching a critical Fibonacci retracement zone. After a sideways trend within the flag, I'm eyeing a potential breakout . A confirmed break of the flag pattern could lead to a continuation move, targeting the clone area of the rectangle box in shortTerm & clone area of a flag pol in medium to longTerm, indicating further upside potential. The pattern may also resemble a triangle formation for the short term, which reinforces the likelihood of an upcoming bullish breakout. I also mentioned my 2nd chunk of buy if it breaks down & reach the level of .
Note: I know, I'm not good in drawing :-D Anyhow, I'm still learning, so if you have any suggestions for improvements, Please let me know, I’d appreciate your feedback. Thank you!
#PTL #GTYR

Again in Buy Area offloaded chunkAfter successfully completing the AB=CD pattern, the stock is now entering a potential buy zone.
Why Buy Range? It's based on Fibonacci retracements: 38.2% of the long wick and 61.8% of the short-term move (CD, which was clone of AB).
However, I'll also be happy if it comes down in my 1st buying area which i already offloaded :-)
Note: I'm still learning, so if you have any suggestions for improvement, Please let me know, I’d appreciate your feedback. Thank you!
#GTYR #PTL


MTL, Bullish RectangleWeekly Bullish Channel
Currently Trading in rectagular accumulation
Retest of weekly bullish channel
Now towards new highs
Entry upon break of rectangle
Entry 680
SL 626
Target Channel top 850-900

PAEL LongEnter once breakout is confirmed, which is strong closing above the highlighted area.
Target is Rs 34.5 - 36

Sheezan Shez is ready to flySheezan is growing consistantly
It maintained level of 109 and
Next resistance level is 124.
124 is key level to fly to 138 & 152
In long run it could cross 200+ level
Note: This is not a buy/sell call.
Use stop loss

OCTOPUSOCTOPUS faced some strong selling pressure from august.
Currently the price is showing some good buying momentum from daily support level.
And price is broke to upside on macro structure.
If the 73 level holds, the upside rally could be extend to 100 level.

FCL Trade1 . Bulish trend start
2 . break of resistance and sustane 3 . no bearish divergence
4 . long trade

UNITY Trade1 . Bulish trend
2 . break of continution pattern
3 . break of resistance and sustane 4 . no bearish divergence
5 . long trade

HINO - PSX - Technical Analysis - CRAB Harmonic PatternHINO is in bull run since 26 Nov 2024. On daily TF, RSI does not show any sign of divergence and KVO is almost vertical suggesting a strong bull run. However, RSI is almost at 85 and at any time trend may retrace to define a proper Higher High.
Resistance Zone 481~530 is critical. Then another resistance line at 700 is present.
On weekly time frame, Crab Harmonic pattern has been drawn, which if respected by price then we will see a very substantial return at TP-4 in 15 months time.
Trade Values
Buy-1 (Mkt): 435
TP-1: 481 (people will sell to book profit around 465)
Buy 2 : 425 (on retracement)
TP-2: 481~ 530 (people will sell at a bit higher values than TP-1)
TP-3: 700 (A small retracement is possible due to profit booking)
TP4: 1630 (For Swing Trading)
Stop Loss: 277 (Kindly modify Stop Loss, as TP-2 is hit to make breakeven for Swing trading).


GGL Trade 1 . Bulish trend
2 . break of continution pattern
3 . break of resistance and sustane 4 . no bearish divergence
5 . long trade
6 . TPs hit 50 % increase

ATLH Trade1 . Bulish trend
2 . break of continution pattern
3 . break of resistance and sustane 4 . no bearish divergence
5 . long trade

HCAR Trade1 . Bulish trend
2 . break of continution pattern
3 . break of resistance and sustane 4 . no bearish divergence
5 . long trade
6 . TPs hit 57% increase
