Bullish Divergence on Weekly TF.
However, still not able to Cross & Sustain 65 - 66.
For now, confluence of Trendline Supports is there
around 53 - 55; lets see if it gets respect or not!
Currently , it is in moving in Sideways.
For a Positive Momentum, it needs to Cross & Sustain 65 - 66.

LUCKY PSX Trade ideaLucky has formed a beautiful cup and handle pattern, possible buy and tp are mentioned.

Bearish Divergence on Weekly TF.
Already made a Lower High on Daily TF.
If 75 is not Sustained on Weekly Basis,
we may witness 66 - 68.

FABL DAILYScrip is Bullish on HTF i.e. Weekly and Monthly and LTF as well BUT it is Bearish on DTF, H4 and M15 Time Frames due to the following reasons: -
Candles are engulfed in the cloud
Formation of a RED cloud ahead, though it is not very dense
Base Line is ABOVE Conversion Line.
Lagging Span has also pierced the candles and if the scrip remains in the consolidation / rangebound state, may inevitably pierce the cloud as well.
BB was slanting downwards, which has recently changed its angle to horizontal.
Daily RSI Value 53.43
ADX 14.56
+DI is ABOVE -DI, BUT with meager margin
The +ve point is that the Conversion Line has changed its angle and started to move Up, which if it continued will result in its crossing with the Base Line and pave way for the scrip's upward movement.

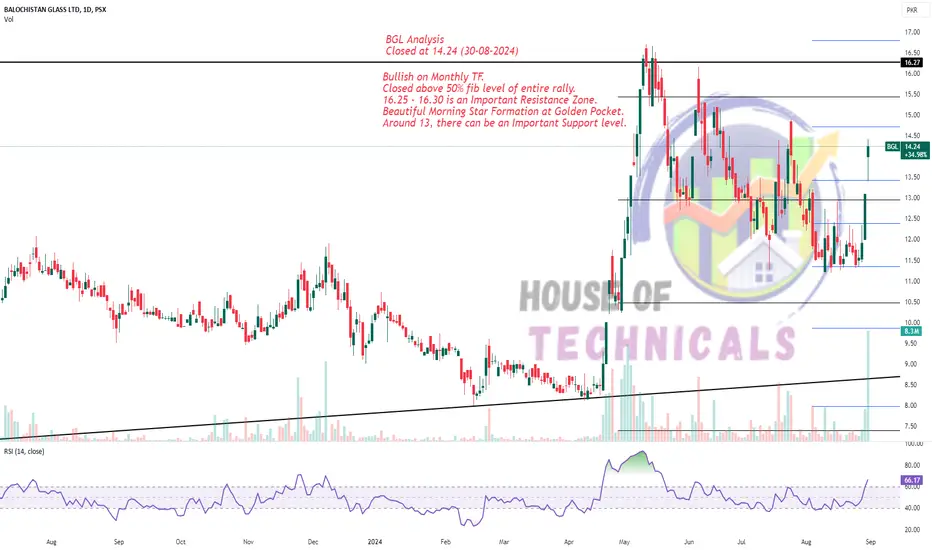
Bullish on Monthly TF.
Closed above 50% fib level of entire rally.
16.25 - 16.30 is an Important Resistance Zone.
Beautiful Morning Star Formation at Golden Pocket.
Around 13, there can be an Important Support level.
LPL currently stuck on DTFPrice is below Kumo and will be receiving a strong resistance from it. Lagging Span is also below the candles and the cloud as well and a such needs to cross all these barriers for a good upside move.

NPL GETTING RESISTANCEConfronting a strong Supply zone which the scrip needs to break & sustain for upward movement. Lagging Span also needs to cross the Base Line, though it has crossed, but with narrow margins. Stock is Bullish on HTF and LTF.

NBP | Bullish StanceNBP is in a strong uptrend, making higher highs and higher lows. It recently broke resistance at Rs. 55 and is trading at Rs. 61.73. The previous resistance at Rs. 55 is expected to act as support. This level could be a good entry point for a long position in a swing trade. The next major resistance is around Rs. 72. If the stock breaks and sustains above this level, it could be a target for further gains. Set a stop loss at the previous swing low of Rs. 45 to manage downside risk.

POL - Preparing for DownfallPOL is currently in uptrend and forming rising wedge pattern. It is also showing a bearish divergence. It may fall after breaking lower trend line and possible short opportunity after breaking previous higher low. Stoploss would be recent high.

FATIMA1. Price in up Trend
2. Forming Accending Channel
3. Price Multiple times test Resistance
4. Volume supported Price movement
5. Momentum is Positive
6. No Bearish Divergence
Risk Management | Discipline | Stop loss is your Friend

COLG upward movement & ResistanceGood movement observed in Scrip which crossed the Conversion Line towards upside and very near to the Base Line & EMA 44 and then subsequently also Intersected with the Base Line and EMA 44 Level. Need to sustain this Resistance Level for further upside move.
Some Resistance was expected from this level i.e. Base Line and the EMA 44 Price Level. Next strong Resistance zone to be confronted is the Kumo itself and the marked Grey zone, which are also overlapping.

PAELAt the end of the trading session, PAEL closed at 24.23 and currently trading around 25. The daily chart show rejection over the last few sessions, and shows a recovering after the fake break out of the parallel channel. Moreover, the price exactly testing 200-day simple moving average and hovering above it. Which indicates a bullish reversal in its price. The RSI is around 45, below the neutral mark, but it shows no divergence from the price, indicating consistent momentum. The MACD being bearish and below its signal line. In the near term, the price seems to touch middle line of the parallel channel around 28 and in the long term the price can pull towards the upper level of the parallel channel around 32. It is recommended to use stop loss just below 200-day SMA at 22.50 to manage risk effectively.

Bullish Divergence on Daily TF.
8.98 - 9 is Important level to Sustain for
further Upside.
if this level is sustained, it may easily touch
9.70 - 9.80 - 10.
12 is an Important Resistance level that would be
reachable if 10.40 is Crossed & Sustained.

WAVESAPP is BullishSince its listing the bears seem to be in complete control of the price action, however matured bullish divergence on daily time frame has signaled that bulls are trying to assume control, and if they manage to break previous lower high then we can expect a bullish rally as per Dow theory. Targets are mentioned on the chart.

ABL is BULLISH for longtermABL is BULLISH and is in process of correction. For long term investment best investments can be done through SIP starting from 100 down to 80.
And the targets to achieve are displayed on chart.

Still Bullish on Bigger TF but.. but Bearish
Divergence has appeared.
Important to Sustain 1032 - 1035
for an Upside move.
If this level is Not Sustained, Next Lower
Levels 927 & 863 will be exposed.

PSX HUBC Range broken- 152 level breached
- Price has broken out of range with heavy volumes.
- In uptrend, new higher high formed.
- Bullish MACD

KEL | Death CrossTechnical Analysis of KEL (K-Electric Limited) Shares
Current Price Behavior and Key Indicators:
Establishing Pattern of Death Cross: KEL shares are currently exhibiting a technical pattern known as a "death cross," which occurs when the 50-day Simple Moving Average (SMA) crosses below the 200-day SMA. This pattern is often interpreted as a bearish signal, suggesting that a downtrend may be in place or could be developing.
Resistance Level: The stock is facing significant resistance around the 4.45 level. This price point has proven challenging for the stock to surpass, indicating a potential barrier for upward momentum. If KEL fails to break through this resistance, the bearish outlook may continue to gain strength.
Support Level: Major support is identified around the 4.00 level. This price point has historically provided a floor for the stock’s price, where buying interest tends to emerge. A break below this support could signal further declines and might lead to testing lower levels.
Trading Below 200-Day Simple Moving Average: KEL shares are currently trading below their 200-day SMA, a key long-term trend indicator. When a stock trades below this moving average, it typically suggests a prevailing downtrend and indicates that market sentiment is negative.
Overall Sentiment:
Given the establishment of a death cross pattern, resistance at 4.45, major support around 4.00, and trading below the 200-day SMA, the overall technical outlook for KEL shares is bearish. Investors should be cautious and consider these indicators when making trading decisions.

GGGL is BullishPrice seems to be in the accumulation phase on weekly time frame, however a matured bullish divergence hints the control of bulls, the bullish sentiment is further confirmed by the printing of first higher high. If this is broken in coming weeks then we can expect a bullish rally from here. Targets are mentioned on the chart.

LCI BEING RESISTEDA couple of days ago LCI made a very good Bullish candle and also touched its High at 1038, but could not go straight further up continuously, reason being, that it was approaching a strong Supply zone , from where it was bound to get resisted and it has not been successful till currently. While analyzing MTF, it was observed that the Scrip was Bullish on HTF i.e. Weekly and Monthly BUT selling was expected on Daily Time Frame and below.

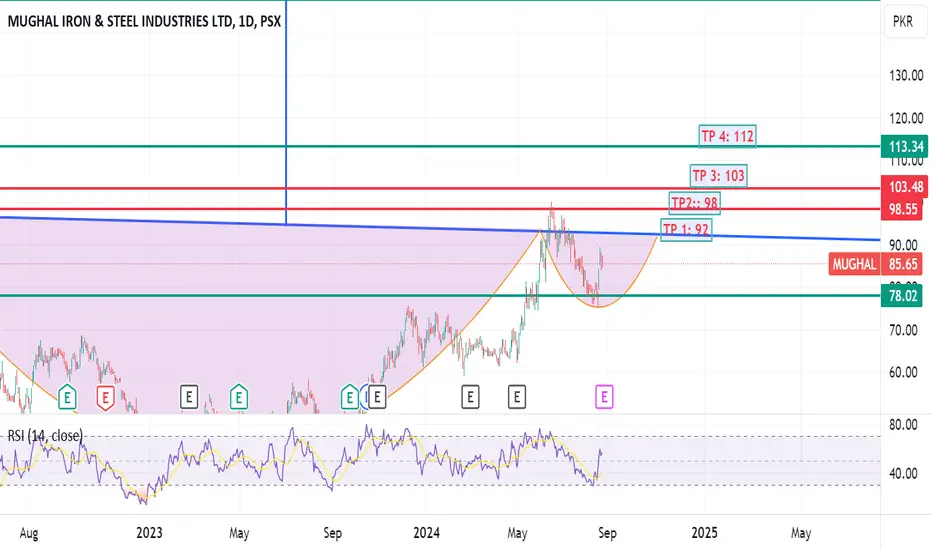
Mughal Long positionCup and handle formation. All the targets are mentioned on the charts. Long term target is PKR 145.
Very Good VolumesVery Good Volumes in last couple of days.
Ascending Triangle formation;
Initial Resistance is around 148; important to
sustain level once it crosses.
a Very Strong Support can be around 130 - 134
& then around 115 - 120

Avanceon buy IDEAIf AVN holds its long term resistance turned into support and keeps moving in the same parallel channel 70 and 80 could be the next targets
