siis - longTrading is hard and it’s not something you can expect to get good at overnight. So if you’re serious about becoming a master of making money on the markets, you’re going to need some top-level schooling. #qatar QSE:SIIS
QFLS: Buy ideaAs you see on the chart we will have a hight probability to have an uptrend if only if we have the breakout with force the vwap and the resistance line! Thanks!

QNBK: Buy ideaOn QNBK as you see on the chart we will have a hight probability to have an uptrend after breakout of resistance line and the vwap indicator!! Thanks!

QIBK Test for structural breaksQSE:QIBK
The price has broken the main rising trend for months - to confirm the validity of the break, the weekly close is below the trend line (it is also possible that it is a false break - if the price is able to close above the trend line with a weekly candle)

MRDS- mazaya qatarQSE:MRDS - 19-2-2024
The price movement in the stock is interesting, especially since the stock touched the main trend line from the descending top in may-2023.
Overbought indicators are nearing completion (in the short term)
I think that if speculators succeed in maintaining the liquidity momentum, we will likely see the stock near 1.055 QR levels again.
This vision is considered incorrect if the price break the 0.6 QR levels
thanks and best wishes
Trading view :QQQ121


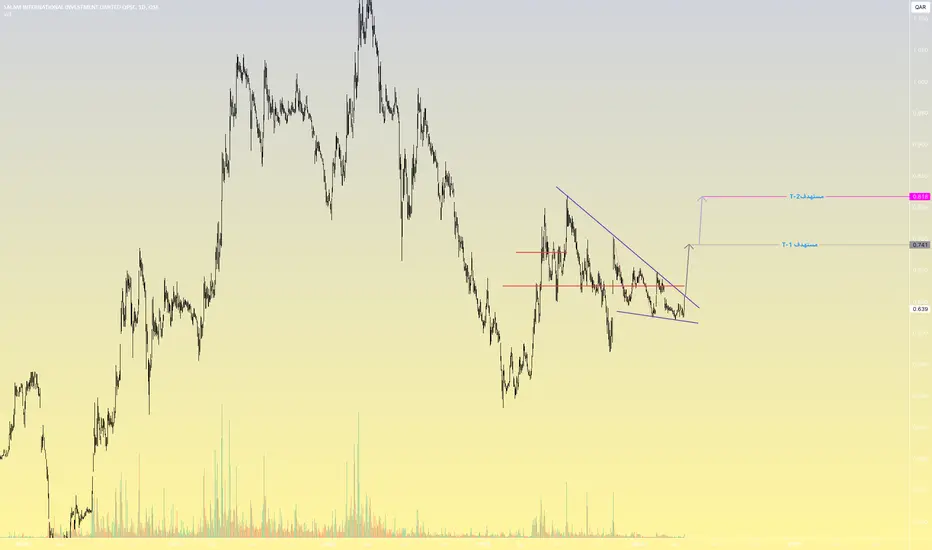
Long SIISPrice reached the bottom of the channel
RSI reached 20
Harmonic ABCD pattern
First goal: 0.75
Second goal: 0.8
Third goal to be updated later, around
Stop loss 0.625

MRDSCurrently, MRDS is in a downward trend, the entry point is 0.648, the stop loss is 0.656, and the take profit is 0.620.

QATAR ISLAMIC BANK IN DAILY CHARTHello to all tradingview investors, according to my previous analysis I see a great opportunity with good probability, the details are reflected in the chart, greetings and good luck to al


QNBKCurrently, QNBK is in a downward trend, the entry point is 15.04, the stop loss is 15.49, and the take profit is 14.00.

QFLSCurrently, QFLS is in a downward trend, the entry point is 15.44, the stop loss is 15.74, and the take profit is 14.00.

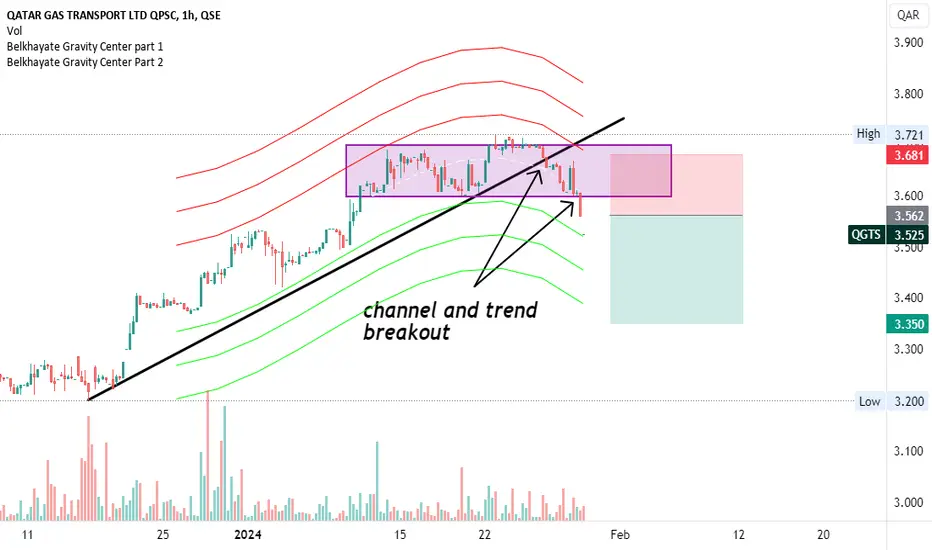
QATAR GAS TRANSPORT ,LTD IN 60 MIN CHART Hello to all tradingview investors, according to my previous analysis I see a great opportunity with good probability, the details are reflected in the chart, greetings and good luck to al
Qatar Aluminum to test support at 1.05On the daily chart, QAMC, is going down to test the support line (red), but can rebound from 1.17 or 1.13
The new buy chance is after rebound from support level to target 1.31 then 1.40
Note: If the stock goes up crossing 1.30, then the previous scenario will void and the target will be 1.47

qfbqI think that the current price is still high... after completing five impulse waves... I see the correction as shown above.
This vision is considered incorrect if the price rebounds above 1.55 levels
Trading is hard and it’s not something you can expect to get good at overnight.

QFBQ- Qatar QSE:QFBQ
I think that the current price is still high... after completing five impulse waves... I see the correction as shown above.
This vision is considered incorrect if the price rebounds above 1.55 levels
Trading is hard and it’s not something you can expect to get good at overnight.

Qatar Insurance to test support at 2.32 then rebound to 2.40On the daily chart, the stock could not cross the resistance line, and is probably going to test the support at 2.32.
Above 2.40, the target will be 2.60 and 2.67
Below 2.32, the target will be 2.07 and 1.98
A second scenario, up directly. Buy now, and stop loss at 2.35 should be considered.
Another trading session is needed to confirm direction!

qibkHello traders ,what do you think about qibk ?
trading is hard and it’s not something you can expect to get good at overnight. So if you’re serious about becoming a master of making money on the markets, you’re going to need some top-level schooling

QJBK: Buy ideaAs you see on the chart we are in a downtrend with a beautiful red candle with a small body and a long wick. This candle tells us that we would have a very high probability of having a reversal of the trend (bullish trend). But for this to be possible, all the analysis conditions must be met. The vwap indicator as well as the resistance line must be broken forcefully by a large green candle and followed by a large green volume. As soon as this is done, we can enter a buy position as soon as the second green candle appears with green volume for added assurance.Thanks!

bldnQSE:BLDN
I expect that prices will begin to recover over time, especially with the company's expansion plans outside Qatar.
Technically, the correction has been completed, as I see it, and we will begin a phase of either a rise or a consolidation

