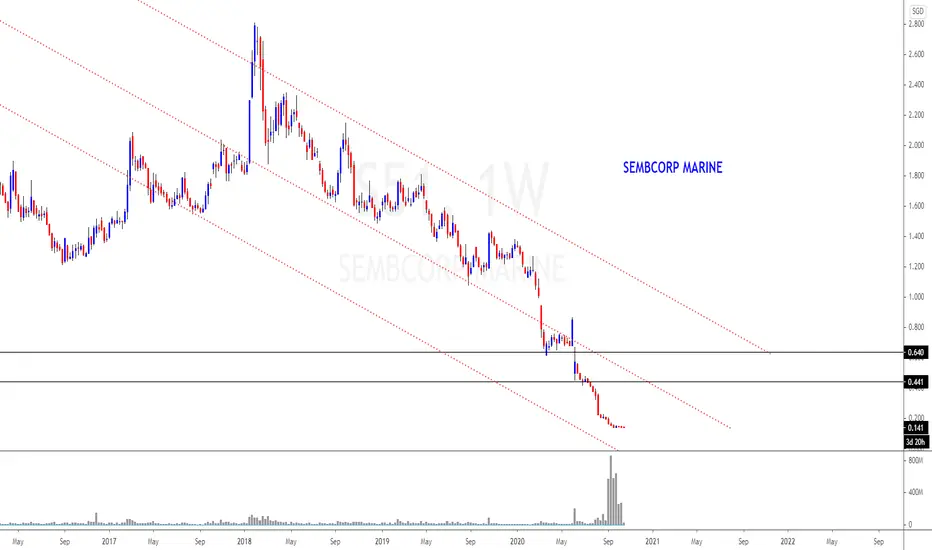
SembCorp Marine (Sink Or Submerge?)View On SembCorp Marine (11 Nov 2020)
SemCorp Marine has turned into a Submarine in the recent months and is it about to change?
We are seeing some bullish momentum gathers right now and 0.124 will be the immediate support.
0.15 will be the next resistant.
Let's see
DYODD, all the best and read the disclaimer too.
Feel Free to "Follow", press "LIKE" "Comment".
Thank You!
Legal Risk Disclosure:
Trading foreign exchange or CFD on margin carries a high level of risk, and may not be suitable for all investors.
The high degree of leverage can work against you as well as for you. Before deciding to trade foreign exchange you should carefully consider your investment objectives, level of experience and risk appetite.
The possibility exists that you could sustain a loss of some or all of your initial investment and therefore you should not invest money that you cannot afford to lose.
You should be aware of all the risks associated with foreign exchange trading, and seek advice from an independent financial advisor.
DISCLAIMER:
Any opinions, news, research, analyses, prices or other information discussed in this presentation or linked to from this presentation are provided as general market commentary and do not constitute investment advice.
Sonicr Mastery Team does not accept liability for any loss or damage, including without limitation to, any loss of profit, which may arise directly or indirectly from use of or reliance on such information.


Wilmar is approaching resistance, potential reversal Price is approaching our resistance where we could see a reversal below this level.

Singtel - Z74 - is the worst priced in?From every view it seems the worst is priced in. It is a different matter whether that is yet come or not. We focus on price actions to make long term investment decisions. Things to note:
1. Dividend Yield as on date : 5.8%
2. Can the company fail? -- Not possible as its a Singapore Blue Chip. Anyone who knows Singapore Market/ economy will not even think about this.
3. Will it continue to pay dividends : History states it will. Remember as a GLC , its one of the revenue sources to shareholders.
I am not putting any SL on this.
As such, there is no reason not buy/invest in it when the banks only pay 0.1% on your savings.

SingTel approaching support, potential bouncePrice is approaching support where we could see a bounce from our buy entry

Singtel is approaching support, potential bounce Price is approaching our first support in line with our ascending trend line , 23.6% fibonacci retracement and 78.6% fibonacci extension where a test of this level could see a bounce from here.

SIA - airlines on the recoveryAfter lying low for about almost 4 months, news of Pfizer covid19 vaccine being 90% successful led to a breakaway gap on strong volume. The stock looks on track for a recovery with 3.80 as the "resistence turned support". However, as there are lots of resistences on the way up, I would consider to scale out partially around 4.40-4.50, then trail the stops up for a possible eventual target of 5.00.
I'll place an initial stop loss @ 3.74 as I do not expect this gap to be closed.
Disclaimer: This is just my own analysis and opinion for discussion and is not a trade advice. Kindly do your own due diligence and trade according to your own risk tolerance. Thank you.


Is a successful vaccine a killer for Gloves stock ?Possibly. We are at the final stage of the vaccine development and it is just a matter of time which company would confirm on the dates. Once confirmed, we are talking about the logistical aspect of distributing it worldwide.
When that happens, would the gloves manufacturers still be in demand as before ? I believe sales may taper down slowly as many countries are still not out of the woods and safety precautions will still be needed somehow.
Distribution of vaccines is going to take time, leaving pockets of opportunities as well. The need for hygiene in sectors like Catering, F&B, airlines, etc would increase and gloves in these sectors may increase to compensate for the declining ones.
Chart wise, can wait for the breakout to take place first. It can go either way, so be patient.

SGX, Long Price bounce of recent low 8.52.
Strong candlestick
Break 9 Should see price heading towards 9.32
Consider accumulation between 8.80 - 9

Wilmar is approaching support, potential bounceA test of our buy entry could see a further bounce above this level to our take profit target.

Bullish Expectations: Broke out of Trading Range (JAC)Sembcorp Ind (U96) traded above its consolidation range (JAC) today.
A summarized analysis, we noted that supply has been weak throughout the 21 days range. We also noted that an early spring on 29 Sept.
On the other hand, demand returned near to the end of the range, with Sign of Strength (12 Oct) and JAC today (15 Oct).
Here's our plan:
Entry: On Open
Target Price: S$1.55- S$1.60
Stop Price at S$1.31 (Below HVN Level)
Trading Stop: 7D SMA
Fundamentally, company may be expecting more solar related projects.


DBS: Triple Tops or Bullish Triangle Breakout?SGX:D05 is in the crossroad, either the Triple Tops will prevail or it will be a bullish breakout.
Based on the current formation, and if we combined with Supply and Demand; it is wiser to wait for Long Setup rather than Shorting it.
As at today there is no LL yet and overall still Buyer in control.
Here is my personal call:
Buy Stop at $21.65
Stop Loss at $21.30
Take Profit at $23.00
Risk Reward Ratio = 3.97R
Potentially, you can buy yourself an iPhone 12 Pro Max 512Gb by end of the year, if you place 1 lot on DBS. Good Luck!
Disclaimer :
The analysis above for educational purposes only, I do not responsible for your losses. Please adjust your own lot-sizing according to your appetite.
If you are benefiting from my trade opinion, please buy me coffee.
As always, move your SL when you are in the profit zone.

Buy upon price break the resistance topISDN has clearly invalidated the head and shoulder formation after prices fails to test and breaks below the neckline resistance at $0.340. Hence we are betting on the odds of prices breaking the triangle top.

Citydev Range Trading From technical point of view, should see price consolidation between $6.80 - $7.10.
Look to trade within the range.
Long on valuation perspective
1) Sell off due to Director resign on disagreement over Sincere Property Group & Millennium & Copthorne Hotels
2) Concern not new, review from External Financial Advisor might help to ease concern
3) Based on 1H20, Cash holding at SGD 2,392,024,000 ( Cash per share S$2.63)
4) NAV @ $11.66/ share

SGX is approaching support, potential bouncePrice is approaching our support in line with our trend line, 61.8% retracement, 127.2% extension and horizontal pullback support where we could see a bounce above this level.


OCBC is approaching supportPrice is approaching support where a test of our buy entry could see a bounce above this level.
