

SGX (Things are about to get nasty)Updated View On SGX (29 MAY 2020)
SGX had a great fall and it has touched to strong swing support region $8 in recent days.
That's the reason why we are seeing some pullback action.
The pullback action may bring the price up higher but s long as it can't swing back above $9.2 region, we will expect to see more bearish actions soon.
DYODD, all the best and read the disclaimer too.
Feel Free to "Follow", press "LIKE" "Comment".
Thank You!
Legal Risk Disclosure:
Trading foreign exchange or CFD on margin carries a high level of risk, and may not be suitable for all investors.
The high degree of leverage can work against you as well as for you.
Before deciding to trade foreign exchange you should carefully consider your investment objectives, level of experience and risk appetite.
The possibility exists that you could sustain a loss of some or all of your initial investment and therefore you should not invest money that you cannot afford to lose. You should be aware of all the risks associated with foreign exchange trading, and seek advice from an independent financial advisor.
DISCLAIMER:
Any opinions, news, research, analyses, prices or other information discussed in this presentation or linked to from this presentation are provided as general market commentary and do not constitute investment advice.
Sonicr Mastery Team does not accept liability for any loss or damage, including without limitation to, any loss of profit, which may arise directly or indirectly from use of or reliance on such information.

ComfortDelGro - Trading in the channelOn bigger timeframe there is a bear flag. On daily it is trading in a channel and formed a double top. Awaiting breakdown.
Disclaimer: Not an advice to buy or sell.

SIA - A break below key support could trigger a further dropPrice is facing bearish pressure from our trend line, Ichimoku cloud where a break below our key support level could trigger a further drop to our take profit target.

DBS - resumption of slow road to recoveryAfter hitting a high of 23.58 recently, DBS has been pulling back in the last 2 weeks cumulating to a low @ 20.63 yesterday but quickly recovered to close a bullish pin bar. Now it that has "successfully" tested the 50% fibonacci retracement of the recent swing up plus having worked off the overbought position to near term oversold now. It looks ready to resume the slow climb back up. (with stop loss just below yesterday's low 20.63)
Disclaimer: This is just my own analysis and opinion for discussion and is not a trade adviDisclaimer: This is just my own analysis and opinion for discussion and is not a trade advice. Kindly do your own due diligence and trade according to your own risk tolerance. Thank you.ce. Kindly do your own due diligence and trade according to your own risk tolerance. Thank you.

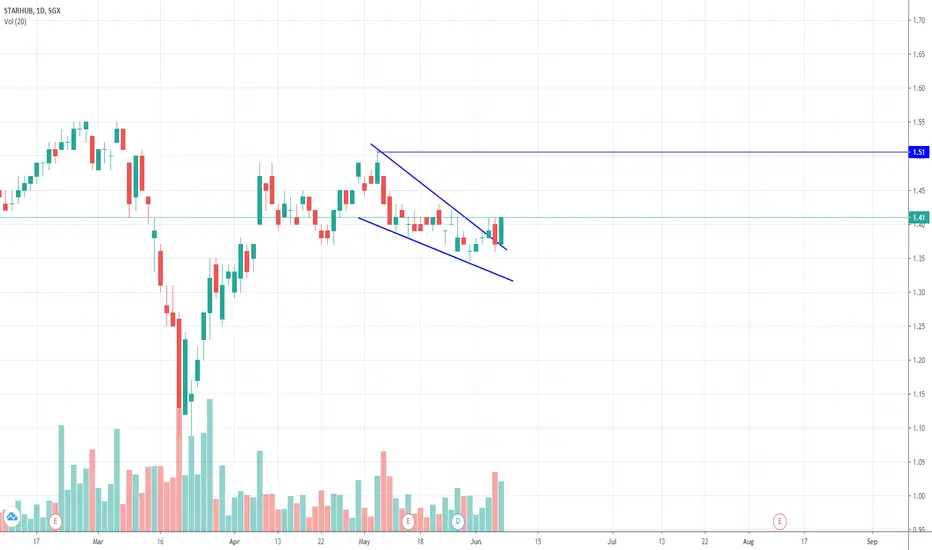
Starhub forming a falling wedgeStarhun (CC3) forming a falling wedge
Disclaimer: This is not an advice to buy or sell!!
Sheng Siong showing great resistance.OV8 showing resistance at current level.. Also forming a Flag indicating bullish bias..
Disclaimer: This is not an advice to buy or sell!!

DBS appraoching resistance, potenatial reversalHey guys, what do you think of DBS(D05.SI)? I have a bearish bias seems like price is facing bearish pressure from our pivot level and 20 period EMA, where we could be seeing a reversal to our first support level.

OCBC testing resistance, potential dropLooking at a short on OCBC Bank(O39.SI) as well here, price is facing bearish bias from our pivot level and 20 period EMA, where we could be seeing a reversal to our first support level.

HK Land - failed double bottom or rvs head and shoulder coming?Price fallen below 20MA
Potential head and shoulder?

JMH - rising volume but falling priceRising volume but falling price is bearish, expect fall to drop more


SGX - Time is Ripe for recoverySGX has been testing the Trendline Support around 8.15 in the past month. Today it tested this level again and is now bouncing just a little above the trendline. However it a weekly bullish divergence (between the stock price and stochastic) is now forming. The chance is better now for a slow recovery to to the upside with initial stop loss just below 8.10.
Disclaimer: This is just my own analysis and opinion for discussion and is not a trade advice. Kindly do your own due diligence and trade according to your own risk tolerance. Thank you.

DBS [1-3 weeks view]Long DBS
Entry: 19.11
SL: 18.35
TP: 20.62
DBS dropped quickly to new lows and is currently in a rebound.
Fibo and graphical level lining up nicely at the TP level.
Price above ascending trendline support and also moving average.
This should be a limited push up as I am generally bearish across the global markets.


Trend analysisClear uptrend, broke resistance level at 0.27, support level at 0.24. Should continue to climb up.


Valuetronics - Upside may be limitedFor traders who like to long, the key resistance at 0.62 is a key crucial level, rejecting it will see the bear resuming its sell down. The only thing supporting the bullish outlook is that the hammer found its support at the immediate support which confluence with the 50% Fibonacci retracement level of the whole bullish up move since 18th March.


Creative, Best tech stock in Singapore last decadeLooking to enter long for this stock, price abit overextend, we are waiting for pullback.
