Descending wedge - bounded within downward channelDescending wedge breakout - bounded within downward channel
Fib at 0.618 level
RSI+ > 50
Above EMA 20 line on daily chart

S08 - Potential breakout of descending channel - AccumulationS08 provides digital services, such as logistic services and e-commerce in Singapore and other regions.
The stock has been in descending channel after the fallout of bearish 3 drives (not shown in current view). Current price is on MA50 with positive RSI. Volume trading appears to be in accumulation.
Do you think this rise to $1 or pull back to $0.9? Let me know in the comments section! :)
Note: This is not financial or investment advise. It will be good to always understand the risks involve in trading. Always trade with stop loss in place. If you like the analysis, please click on "thumbs" u; "like" button. Thank you.

Thomson - Potential explosion of ADAM & EVE ^_^Thomson medical - does it looks like an Adam and Eve formation? If its valid, get ready for an explosive ride up! Hold on tight =)
Feel free to share your thoughts. Let me your comments in the box below.
Note: This is not financial or investment advise. It will be good to always understand the risks involve in trading. Always trade with stop loss in place. If you like the analysis, please click on "thumbs" up; "like" button. Thank you.

AusGroup - Exponential power to the Moon~! To the Moooooon? What do you think?
Feel free to share your thoughts. Let me your comments in the box below.
Note: This is not financial or investment advise. It will be good to always understand the risks involve in trading. Always trade with stop loss in place. If you like the analysis,


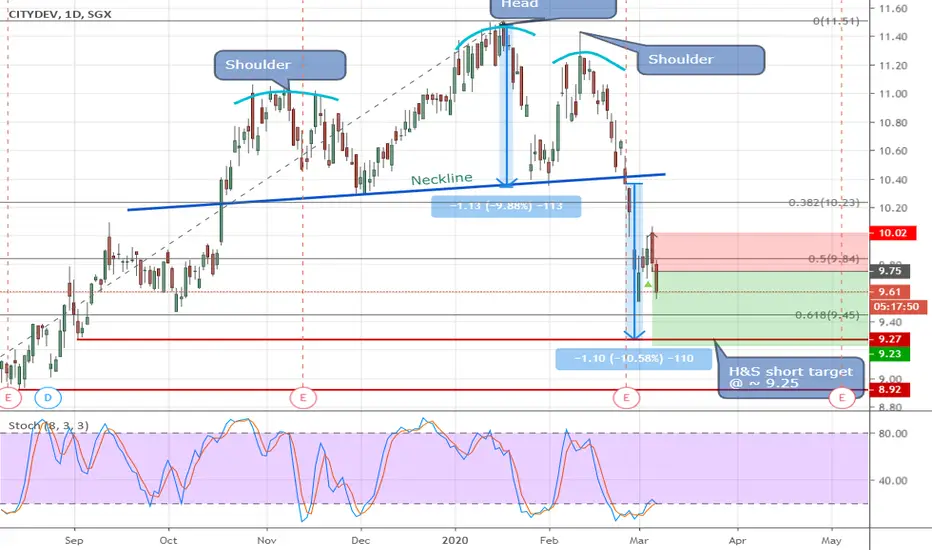
City Dev - Miss the H&S opportunity to shortI must have been blind not to see the glaring Head & Shoulders for this chart until now. Broken down the neckline at 10.40 (the ideal short entry) and H&S target around 9.25. now late in the game and will just stay at the sideline .. :(
DBS - Challenging levelsDBS with strong fundamental and liquidity seems to be ignoring the usual local "must-buy" recommendation as selling pressure remains high.
This Stock has a high correlation with STI, as both heads towards a level where market seems to be able to break.
A "short" position seems to hold a higher winning probability than a "long" one
Also, i'm writing at www.patreon.com
This is not a call to act, kindly do your own diligence

LONGin 45 mins chart found hammer pattern as of break out of second bullish candle of high 52.99 it seems it will reach target 54.2
SL=51.78
TP1=54.2
For profit ride u can use the MACD
note you can make position of long by your own risk

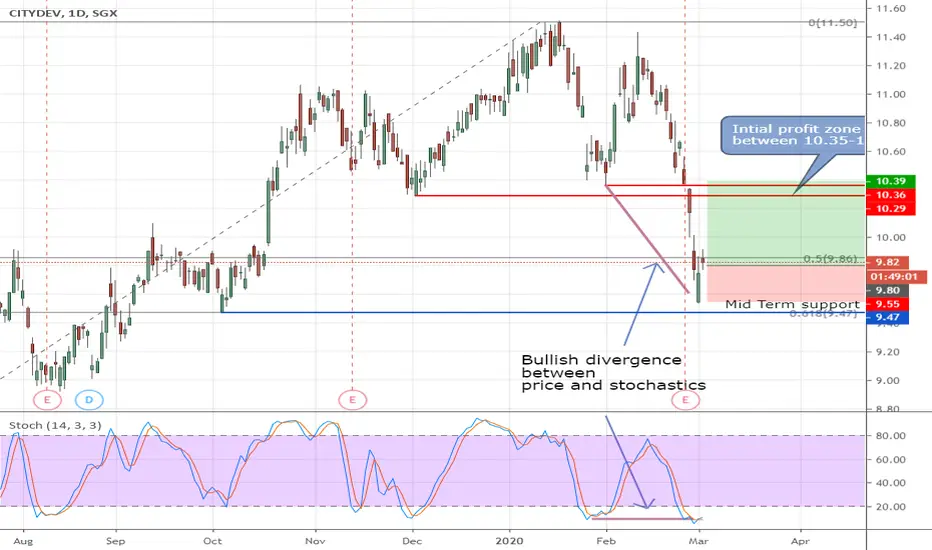
CityDev - Bullish divergenceCityDev fomed a bullish divergence near the horizontal and 61% fib retracement support and rebounded with a somewhat bullish morning star formation (somewhat as it isn't a perfection morning star). Will to take the chance to long at 9.80 with a tight stop at 9.55 and looking to take initial profits as it reaches resistence between 10.35-10.40.


SGX [1-3 months view]I expect SGX in the short term to pull back towards 8.70 as long as it is holding below 9.38. After which, we should see a bounce reaction from 8.70 towards the alternative case target at 9.75.
Essentially, this is 2 trading ideas in 1.
Part 1: SGX to push down towards 8.70
Part 2: SGX to bounce and move higher to 9.75 thereafter.
Reason being that price is still holding above the long term ascending trendline support.

Where is SingTel Heading ?Was chatting with an old friend and guess where we worked together last time ? No points for guessing.
Harmonic Patterns we originally created based on the studies on Stock prices. So yes it does work on Stocks & Indices too
I see two possibilities:
1. Bounce off the ABCD pattern at $3.00
2. Head slightly lower to complete the Bullish Crab Pattern at $2.84, confluence at the horizontal support


Bullish Butterfly on SingTel Bullish Gartley on SingTel daily chart
Previous day candle closed as Doji

SATS- Downside is still strongSATS have further downside till the dmeand area and 161.8% extension level. We believe a bullish rebound can happen at 4.16-4.07

Venture , the sleepy giant awakes!!!It is high time that this sleepy giant wakes up and rise to its occasion.
We are now in a symmetrical wedge but bullish trend as well.
You can wait for the breakout of the bearish trend and buy on pullback with profit target aiming at 20.00. Once this hurdle is crossed, we can then look at 22 and more.

AusGroup (Something is Brewing!)View On AusGroup(15 Jan 2020)
Something is brewing in AUGgroup and it is going to worthwhile to check it out.
It may do some pullback but we are more likely in the change of trend now.
It is getting more Bullish IMO.
DYODD, all the best and read the disclaimer too.
Feel Free to "Follow", press "LIKE" "Comment".
Thank You!
Legal Risk Disclosure:
Trading foreign exchange or CFD on margin carries a high level of risk, and may not be suitable for all investors.
The high degree of leverage can work against you as well as for you.
Before deciding to trade foreign exchange you should carefully consider your investment objectives, level of experience and risk appetite.
The possibility exists that you could sustain a loss of some or all of your initial investment and therefore you should not invest money that you cannot afford to lose. You should be aware of all the risks associated with foreign exchange trading, and seek advice from an independent financial advisor.
DISCLAIMER:
Any opinions, news, research, analyses, prices or other information discussed in this presentation or linked to from this presentation are provided as general market commentary and do not constitute investment advice.
Sonicr Mastery Team does not accept liability for any loss or damage, including without limitation to, any loss of profit, which may arise directly or indirectly from use of or reliance on such information.

SG DBS BREAKING DOWN DBS is very weak now. Having bounced off 25 twice in recent time, it failed to make higher highs, failed the 55EMA, and is likely to revisit 25.
MACD supportive of bearish bias.
Going for a bounce at 24.50, and to consolidate at 24 for deliberation of a possible major rally to 40.

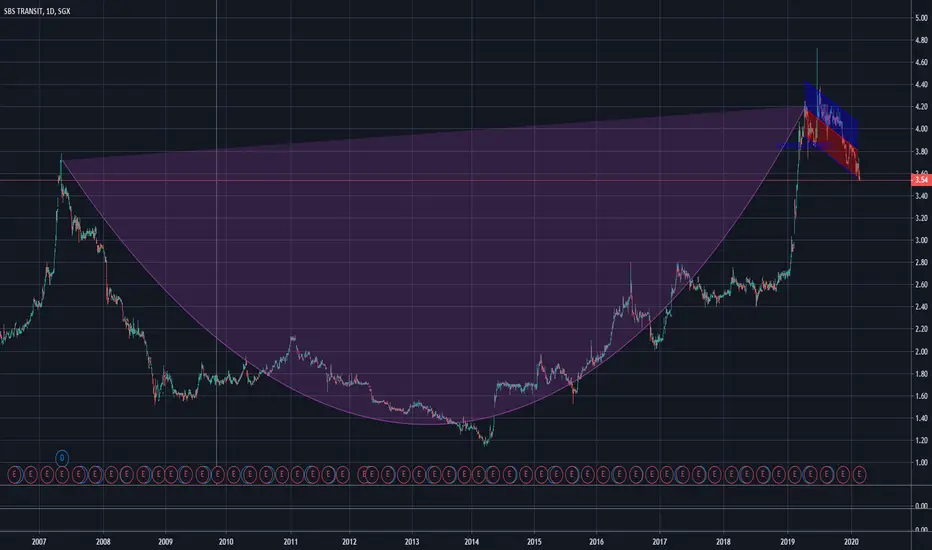
SBST - Is this forming cup & handle?Keep in view of this counter - it may form a potential rise. What do you think?
Feel free to share your thoughts comments box. Note: This is not financial or investment advise. It will be good to always understand the risks involve in trading. Always trade with stop loss in place. Thumbs up if u like the analysis :)
Using Pareto Principle to analyse stockRead about this company business here
According to its annual report, 73% of its revenue is derived from the 3 attractions in China.
And it has closed down 3 of these attractions , read here .
So, using the 80/20 principle , if a company generates 80% (in this case is 73% to be exact) from 20% portfolio and there are no other streams of revenue coming in during this period, then this company is in trouble.
Rent is ongoing though there might be some concession from the Chinese Government. However, with the closure, it is like a sitting duck in the river , awaiting for short sellers to shoot it down.
From the chart, since reaching a peak at 1.115 in 2015, it has been registering lower high and lower low price movement, a bearish signal. An important support at 0.685 is broken recently on 2 Dec 19 and it is now sitting on the 2nd level of support at 0.57.
I know this is one of the favourite among many dividend investors as it generates a 6% dividend. But would this still holds in current circumstances ?
Nobody knows how long will they get to reopen their attractions and having missed the festive season - Chinese New Year , they had potentially lost tons of money from the closure.
I am of the opinion that this stock will still heads south , perhaps towards 0.445 or even lower in the forthcoming weeks and months.

Singapore Technologies CrashChinese supply of tech has ceased, expecting this company to begin crashing soon.
-Hawk

You are the disease, I am the cure !We know for a fact that the coronavirus has caused pretty bad damages to the tourism industry with Disneyland and other theme parks closing down temporarily. So are airlines being forced to halt flights in and out of China. The F&B and casinos are not spared either.
So, with diseases lurking , people wants to find a cure. That started the frenzy and crazy buying of many biotech stocks worldwide that may or may not have a direct relationship to finding the cure for the virus. Some are still in incubation stage or indirectly involved in the medical chain but traders and investors are drumming up the prices to rocket high without considering the valuations of the company.
Let's assume you bought after the breakout at around 0.99 level. It shoot up to a high of 1.30, a 30% returns in a very short period of time. This temptation drives speculators into the market and greed overcomes logic and everyone tries to fool everyone that there is a next higher price.
This post mortem analysis helps us to stay grounded to using trend line strategy. First you buy but you need to know where to take profits. At 1.24, it was the Nov 18 peak which tells you if the price does visit this or cross this level, you must be extra careful.
The circle zone are where you should take profits (last resort) or you could have place your targets at exactly 1.24 as well. Say you were caught in the frenzy and sold off at 1.16 , 2nd red candle closing price, that would gave you more than 20% profits. Every 1000 invested , you get 200 profits.
But if you are greedy and let emotions run over your logic, then when it plummet down to 1.04, you are left with barely few cents of profits if you managed to get out.
Will the price goes higher ? Possibly as it has already broke out of the bearish trend line or it might consolidates for a while unless new evidence supports it to go higher.
Thus, by combining trend line and price action, you can have your cake and eat it.
To many traders, it is not just the profits they are after but the fact that they got it correct, predicting the right direction and maximising the profits that truly makes their day. Of course, there are traders who are good at that but the majority of us are not that skilful. We must know our strength and weaknesses to play this game. If you can gain 30 profits out of 100 and out of 10 games, you win 5, in the long run, you are going to be OK. It is the consistency of winning that is the challenge.
So, keep on practising and keep the rules of trading tattoo to your heart. Always use a SL, apply appropriate risk and capital management. When greed takes over, one may increase his position unnecessarily , hoping to gain more at a shorter period of time. This is very dangerous and done in a reckless manner, it can blow your accounts after accounts.
