BANCO SANTANDEROnly if there is a clear exit from the triangle upwards.
solo si hay una salida clara desde el triángulo hacia arriba.

Bailout coming - BBVA and their podcast experts (LMAO)So I've decided to somehow repost this big scheisse after the bank doesn't stop sending me emails saying they have experts analyzing the markets and wanting to give an explanation of why the stocks are going up. Really? Who are they trying to convince with this graph?
It will be bad, very bad. And in the end we will always pay for it, always the same. Enough! Because all spanish big banks are all almost in the same situation. If you want to check other countries issues: METRO, DB... can continue forever. Buff, I'm so annoyed today.
Be careful outside!
End the FED, end this fractional reserve system. Burn them all down soon.

ITX - Zara is going to re-open his shops country by countryITX is going to recover the 32 EUR in the next weeks, today 3.8%
www.informador.mx
www.lefigaro.fr

IAGIAG in reaccumulation range.
Buy at 2.2
Sell at 2.5 (15%)
Stop at 2.14 (-3%)
Profit risk ratio = 0.3:0.06 = 5:1

Inditex long term trendMultiyear view of Inditex.
- Distribution (Wyckoff) from 2015 to 2017. Range 29 to 32. Blow off top on 36 euros.
- Second redistribution from 2018 to 2020. Range 24 to 28. Blow off top on 32 euros.
- Potencial third redistribution 2020 to 2022. Range 18 to 24:
Topping on 32 euros in December 2019.
Almost 50% drop on March 2020
A - Support on 18,56 following 2013-2015 trendline
B - Rebound in April 2020 to 26 euros
C - Potencial C wave to 14 euros implying a 56% drop, this would be a shake out on the third redistribution.
Potential catalyst for C Wave is 1-2 months after re-opening of stores across Spain and Europe as only 30% of stores in Spain are re-opening and people may not return to pre-covid consumption habits, this may cause a 30-50% drop in sales
Entry point: 24
Stop loss: 25.5
Take profit 1: 20.64
Take profit 2: 19.7
Take profit 3: 18.47
Take profit: 14.47


TEL: 4.88 Target Is Reasonable; High Risk LongTelefonica seems to have position for another wave breakout or some sort of bullish run. Again, don't take what I say seriously or at face value (as always), this is an opinion basis. That being said, let us get into my analysis. Looking at a long position target, you could see the 4.88 target range as feasible going into the upcoming years, or some sort of +15% growth potential as a conservative estimate. Some targets are even looking into the post $6 to $7 range quite soon, and it does look like it already passed most of its bottoming up period. The market capitalization of Telefonica is also huge, and that isn't really easy to all go away. Points like this, should make it a good stock pick. However, the problem lies on the fact that it is very high risk at the moment given its past negative correlations performance and how investors may react.

#BBVA - In big steps #BancoBilbaoAfter almost 2 years, Banco Bilbao share is still on target.
A bailout/bailin is imminent and should lead to riots or even revolution in another 2 years.
In 2018 this was still unimaginable and today hardly anyone would doubt it or rule out the possibility, would they?

Atresemedia may reach 3,33€ +30%Due to a double bottom structure that has been activated Atresmedia may reach 3,33€ +30% from current price with a reward ratio of 6,8. Stop loss at 2,44€.

Pharmamar may reach 7,06€ +50%It seems that Pharmamar may reach 7,06€ (+50% from current price) after activating an iSHS and improving its rating.


Triangle pattern on RepsolAs well as the price oil is in the lowest, the oil companies do the same. Nevertheless, that can be a good opportunity for those who own strong liquidity to buy low.
So in this contexte, here we have Repsol with a monthly triangle pattern. We can hold a long position for long terme. In my case y prefere to catch long mouvement on daytrading.


GRIFOLS - STRONG PICK LONGI think in this covid19 scenario grifols is a really good pic with the medical improvements that they are offering.
It's a safe pick so i recommend reading about this coorporation and make your own research.


Intl. Consolidated Airlines (IAG) seguimiento y previsión. Parece que no habrá remonte por arriba de los 3 euros/título hasta que pase la crisis del SARS-CoV-2. %R de Williams no muy efectiva si la previsión es en largo. Para posiciones cortas las jugadas oscilan alrededor de +-20 céntimos.

SABADELL short with target price at 0,6336€ -15%AB = CD structure activated for Sabadell with target price at 0,6336€.

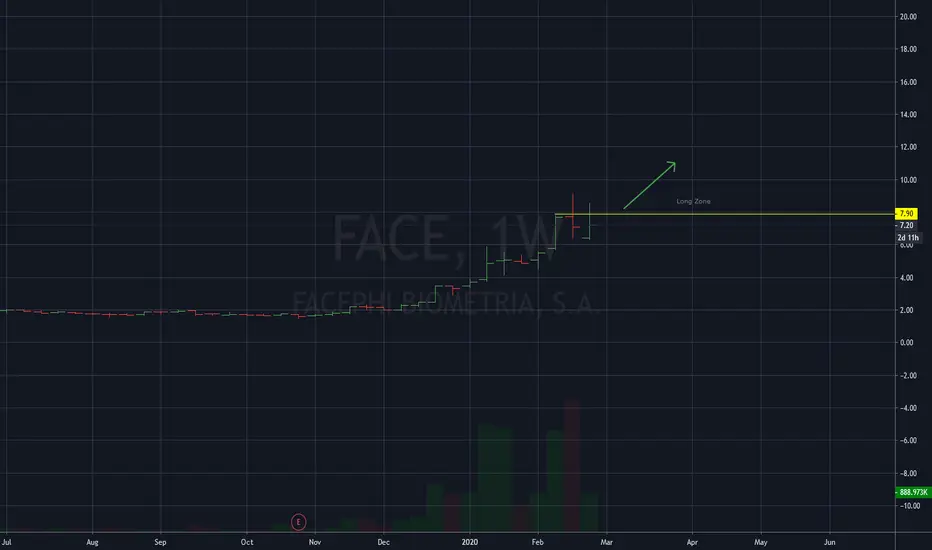
FACEPHI BIOMETRIA, S.A
BME:FACE
Cherry on the cake of recent days.
While the entire market is falling, FacePHI is growing up.
Paper is clearly stronger than the market.
I take it in my long-term portfolio.
Repsol bullish wedge target to 16.3 € +29%It seems that Repsol is in the point of a throwback of a bullish wedge with a target at 16.3€ +28.84% from current price. There is also a trading range target pending at 20.4€ +61% from current price.

Mapfre with 2,6€ target after breaking bearish wedge +10%Mapfre has broken a bearish wedge with a possible target at 2,626€, with +10% potential from current price.

ACS corto con objetivo 28,7€ACS podría caer hasta los 28,7€ por acción después de haber hecho un doble techo. Potencial de caída de 10% desde precio actual.
