JKH.NDisclaimer;
The information provided on this website does not constitute investment advice, financial advice, trading advice, or any other advice, and you should not treat any of the website’s content as such. We do not recommend buying, selling, or holding any stock. Nothing on this website should be taken as an offer to buy, sell or hold a stock. Conduct your due diligence and consult your financial advisor before making investment decisions.
I do not accept any responsibility and will not be liable for the investment decisions you make based on the information provided on the website.

SMOT BEARISH SETUPWe have witnessed a major resistance zone under the monthly timeframe with multiple price rejections formed close to this area. We are expecting a retracement next, if the price remains unbreakable above the highlighted zone.

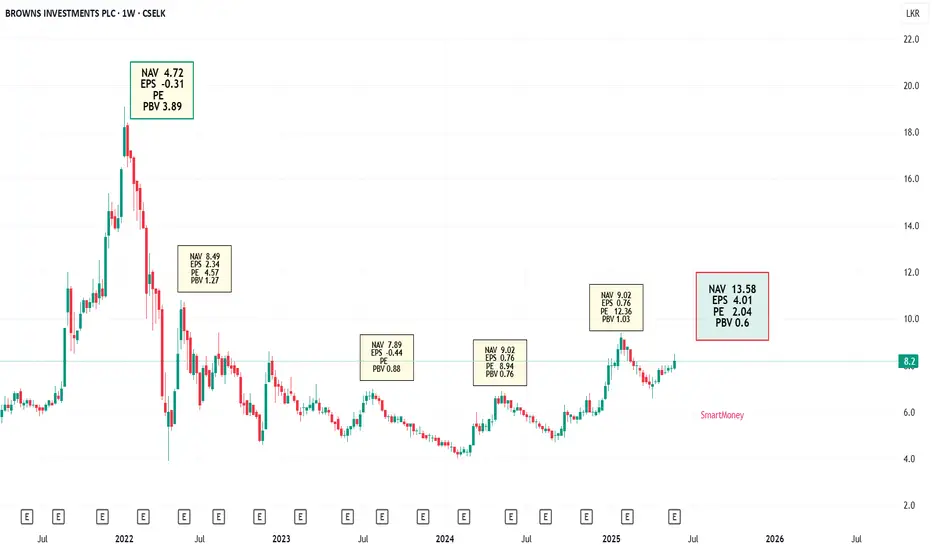
BROWNS INVESTMENTS PLC : BIL.N0000 : CSEBIL is currently trading at lowest ever valuations.
With FY 2024/25 results
NAV 13.58
EPS 4.01
PE 2.04
PBV 0.6
2022 Jan Peak
NAV 4.72
EPS -0.31
PE
PBV 3.89
PARQ.N00001. Current Trend and Price Action
Uptrend: The stock is in a strong bullish trend, with consistent higher highs and higher lows evident in the weekly chart.
Key Resistance Levels:
The stock is approaching a critical resistance zone between 36.7 (0.618 Fibonacci level) and 38.0 (0.65 Fib level). These levels could act as barriers unless strong buying momentum continues.
Support Levels:
Immediate support is at 32.5 (0.5 Fibonacci level). If the stock pulls back, this level should act as a strong support zone.
Additional support lies at 27.2 (0.382 Fib level) if further corrections occur.
2. Fibonacci Analysis
The 0.618 (Golden Pocket) zone at 36.7 is a critical level to watch. If the stock breaks above this zone, it may head toward the 0.786 Fib level (~43.4).
All-Time High Target: The 1.0 Fibonacci level at 52.0 represents the potential all-time high target if the uptrend continues.
3. Indicators
RSI (Relative Strength Index):
The RSI is currently at 76.89, indicating that the stock is in the overbought region. This suggests a potential for a short-term pullback or consolidation before continuing the upward momentum.
Volume and Momentum:
The recent candles show strong bullish momentum, supported by rising volume. However, caution is needed as the price approaches the resistance levels.
4. Observations
Bullish Case: If PARQ breaks above 38.0, the next target would likely be 43.4, followed by 52.0 as the long-term target.
Bearish Case: Failure to break the 36.7 - 38.0 resistance zone could result in a pullback toward 32.5 or even 27.2.

CHL BULLISH SETUPBreakout on the weekly trend hints us a potential rally laddering up towards the 138-148 region

LOLC FINANCE PLC : LOFC.N0000 : CSETechnical Analysis (Chart Patterns)
* LOFC had created a double bottom (W pattern) indicating a probable bottoming out process.
* Neckline is LKR 6.20
* If breaks out LKR probable pattern target is LKR 7.10

BROWNS INVESTMENTS PLC : BIL.N0000 : CSETechnical Analysis (Chart Patterns)
* BIL is about to break out from a reverse head & shoulder pattern indicating a bottoming out process
* Probable pattern target LKR 9.40 (if breaks out)

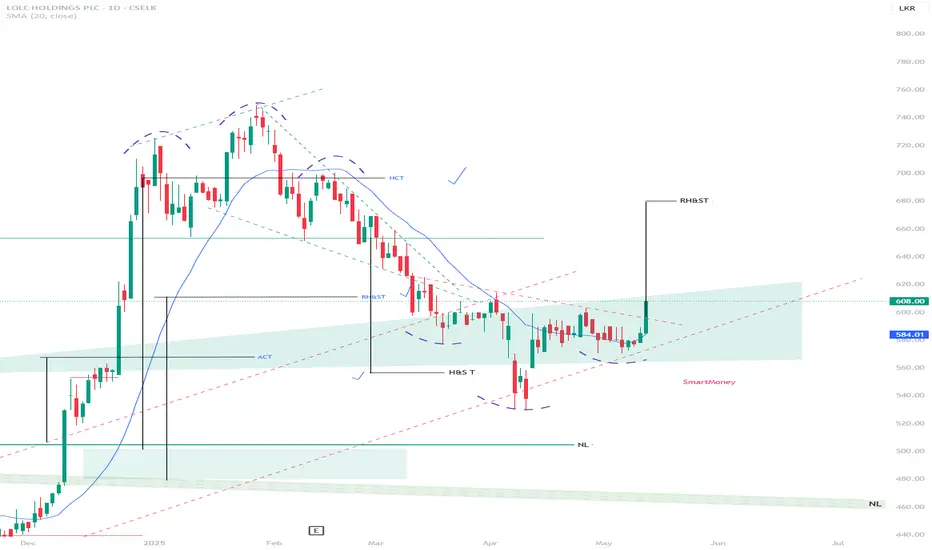
L O L C HOLDINGS PLC : LOLC.N0000 : CSETechnical Analysis (Chart Patterns)
* LOLC breaking out of a reverse head & shoulder pattern indicating a bottoming out process
* Probable pattern target LKR 680.00
hSenid Business Solutions PLC : HBS.N0000 : CSEOverview
HBS is an application software development company mainly catering to HR segment.
Strategy
A trade based on technical analysis.
Technical Analysis (Chart Patterns)
* HBS had created a bottom with a triple divergence.
* Friday 11th April HBS broke out from the Descending Wedge formation with good volume.
Potential Pattern Targets
* Pattern Target : LKR 12.60 (> 14% upside)
* If price sustained above UC line we can aim for higher targets towards LKR 16/17 area.
Invalidation
* Daily close below the broken pattern resistance line.

TPL.NDisclaimer;
The information provided on this website does not constitute investment advice, financial advice, trading advice, or any other advice, and you should not treat any of the website’s content as such. We do not recommend buying, selling, or holding any stock. Nothing on this website should be taken as an offer to buy, sell or hold a stock. Conduct your due diligence and consult your financial advisor before making investment decisions.
I do not accept any responsibility and will not be liable for the investment decisions you make based on the information provided on the website.

CALT.NDisclaimer;
The information provided on this website does not constitute investment advice, financial advice, trading advice, or any other advice, and you should not treat any of the website’s content as such. We do not recommend buying, selling, or holding any stock. Nothing on this website should be taken as an offer to buy, sell or hold a stock. Conduct your due diligence and consult your financial advisor before making investment decisions.
I do not accept any responsibility and will not be liable for the investment decisions you make based on the information provided on the website.

SAMP.NDisclaimer;
The information provided on this website does not constitute investment advice, financial advice, trading advice, or any other advice, and you should not treat any of the website’s content as such. We do not recommend buying, selling, or holding any stock. Nothing on this website should be taken as an offer to buy, sell or hold a stock. Conduct your due diligence and consult your financial advisor before making investment decisions.
I do not accept any responsibility and will not be liable for the investment decisions you make based on the information provided on the website.

MGT.NDisclaimer;
The information provided on this website does not constitute investment advice, financial advice, trading advice, or any other advice, and you should not treat any of the website’s content as such. We do not recommend that any stock should be bought, sold, or held by you. Nothing on this website should be taken as an offer to buy, sell or hold a stock. Conduct your due diligence and consult your financial advisor before making any investment decision.
I do not accept any responsibility and will not be liable for the investment decisions you make based on the information provided on the website.

JINS.N0000 Janashakthi Insurance - Cup & Handle BOBreaking 46 will make a C&H Break Out.
Dividend Pending
* Amount > LKR 5 (JINS can distribute tax free dividend received from CFVF.N0000)
Profit Expectations
* Earnings should be good.
* Majority of BOND portfolio is classified under 'Financial Assets at Fair Value Through Profit
or Loss'. Hence capital gains due to rate cuts will reflect in P&L.
NAV
* LKR 60.64 / PBV 0.75 (All other life insurance companies in CSE are trading above NAV.)

HELA APPAREL HOLDINGS - HELA.N0000 (CSE/Colombo Stock Exchange)Strategy
Expected recovery in Garment & Textiles Industry & HELA's 180-degree turnaround strategy implementation
- Cost Reductions
- Capacity optimization (maintaining demand base capacity)
- Benefits from acquiring of Focus Brands Limited
Historical Facts
* IPO Price - LKR 15.00
* IPO Debut price - LKR 22.00
* HELA got affected from garment industry crisis during CY 2023 (Supply Glut)
* 52 Week High/Low LKR 8.60/LKR 4.80
Technical Analysis (Chart Patterns)
* If HELA managed to cross LKR 6.20/6.30 range, if will make a Cup & Handle pattern breakout
* Interestingly from LKR 6.40 to LKR 8.00, there is a considerable VRPV Gap which can provide a volatile move
* 50/100 MA Golden Cross is about to happen
Potential Pattern Targets
* Previously broken multi week descending wedge target LKR 8.00
* About to break C&H pattern pointing towards LKR 8-8.20 range
Fundamentals & business outlook
* Sri Lanka's Garment Industry start recovering during Q4 2022/23
* In the month of March 2024 Sri Lanka's garment & textile exports recorded a YoY growth 6.66%, after > 12-month negative growth period
* HELA's GP margins improved by 8.4% during Q3 (during Dec Q)
* OP & NP margins improved 580 & 220 bps
* Notable cost controls are visible in managing distribution/administration expenses
* One-off value gain from FOCUS acquistion is expected to be recorded in the 4th Quarter results

DOLPHIN HOTELS PLC : #CSE # Sri LankaFundamentals
NAV : 51.03
PBV : 0.68
DEC Q EPS : 1.33 = FWD 1Y EPS : 5.32
FWD PER : 6.5
CASH BALANCE : 1.2 B
FREE CASH / SHARE : > LKR 8
Lowest valuation for any Hotel Share on CSE ( Colombo Stock Exchange

LFIN.NThe information and analysis provided in this publication are for educational purposes only and should not be construed as financial advice or recommendations to buy, sell, or hold any securities. The author and Trading View are not responsible for any investment decisions made based on the content presented herein.
Always do the own research on stock market before making any investment decisions.

RIL Prediction (2024 Dec 24) - RetracementNot a BHS recommendation. Just Sharing my idea.
CSELK:RIL.N0000 - The overall weekly trend is uptrend.
Timeframe - Daily
Higher High is formed @13.80 and Retracement is already happening
Possible reversal between 12.5-12.4 (From the highlighted red box)
Confirmations for the reversal:
Close to Fibonacci golden pocket
Hidden bullish divergence is formed
Fundamentals:
NAV is according to the latest financial statement (2024 Sept quarter) is 25.52. So PBV is below 1.
RIL has 51% ownership of CSELK:UML.N0000
Expecting to reach the Price to 15, which is the next daily resistance. The uptrend resistance might also intercept this resistance level at 15.

PLC.N0000 - Long term viewWait for pullback to 7 to 9
Disclaimer: The information and analysis provided in this publication are for educational purposes only and should not be construed as financial advice or recommendations to buy, sell, or hold any securities. The author and TradingView are not responsible for any investment decisions made based on the content presented herein. Always consult a financial professional before making any investment decisions.

PARQ - The LeaderThis is not an advice. Purely a personal opinion.
CSELK:PARQ.N0000
In the Stage Analysis method, the Advancing stage occurs when the stock breaks free from the Base and 30-week moving average.
The price of CALT moved up rapidly after breaking out the Base from the 30-week moving average.
After the breakout, it increased its advancement by a staggering 677%.
Similarly, PARQ is in its advancing phase and is backed by strong fundamentals.
It has only gained 165% gain from its breakout.
While observing the volume profile, it is noticeable for even a blind man that there is a freaking interest in the stocks.
Sellers are getting hammered daily, making them regret their decisions.

LIOC.N00001. Key Technical Observations:
Price Breakout:
The stock has broken above a critical resistance level at 122 LKR (DR). This breakout indicates strong bullish momentum in the short term.
Trendline Resistance:
The stock is currently testing the descending trendline resistance (black diagonal line). A clear breakout above this trendline with volume confirmation could trigger a move toward higher levels.
Support and Resistance Levels:
Immediate Resistance: 124.50 LKR (current level) – needs a daily close above this zone to confirm a continuation of the uptrend.
Support Levels:
117.75 LKR (DM): Acts as immediate support.
115.75 LKR (DS): A fallback support zone.
111 LKR (WM): A key weekly support zone.
2. Indicators:
RSI (Relative Strength Index):
RSI is at 74.14, indicating that the stock is overbought. This suggests the possibility of a short-term pullback or consolidation.
MACD (Moving Average Convergence Divergence):
The MACD line has crossed above the signal line with increasing green histogram bars, signaling a bullish crossover and momentum.
3. Volume and Sentiment:
The breakout above 122 LKR occurred with significant volume, signaling strong buyer interest and bullish sentiment.
Volume confirmation is crucial for validating further upward moves.
4. Potential Targets:
If the stock breaks above the current 124.50 resistance and the descending trendline, the next potential targets are:
130 - 135 LKR Zone (based on previous highs).
Followed by higher levels depending on momentum.
Failure to sustain above 124.50 could see the price retesting supports at 117.75 LKR or 111 LKR.

AEL Prediction (2024 Dec 11) - Retracement Not a BHS recommendation. Just Sharing my idea.
CSELK:AEL.N0000 - The overall trend is uptrend.
TimeFrame - Daily
Higher High is formed @31.80 and Retracement is already happening
Possible reversal @29.80 (From the highlighted green box)
Confirmations for the reversal -
Fibonacci levels (0.66 and 0.618)
The Previous Up-Trend Resistance has now become a Resistance
Hidden Regular Divergence is possible which is a Trend Continuation Divergence
Expecting Reach the Price to 35 which is a Weekly Resistance

Celon Tea brokers is ready to goYou can see the frypan formation in the chart for Ceylon tea brokers. When the frypan breaks the chart price can reach the level I mention in the black line. So keep watching this chart and try to gain from it.
