GLAS1. During the previous run to ATH it happened in 4 phases with % reducing.
This time first three phases happened with marginal reduce in %
2. Last time when 52 week high was broken the following week went up by 30%
3. When the previous channel was attempted to breakout, it got rejected and ended up breaking down. After the most recent attempt to breakout channel, it held at midway of channel and moving towards another attempt to BO
4. Moving Averages aligned and turned upwards
5. Trading above Volume Weighted MA
6. Compared to the first impulse, other impulses happened with low volume.


BIL.N - BROWNS INVESTMENTS PLCDisclaimer: This chart and analysis are not meant to be, and do not constitute, financial, investment, trading, or other types of advice or recommendations. Do your own due diligence before trading or investing in any stock exchanges, Indices, Stocks, Forex, Crypto etc.
CSELK:BIL.N0000
BIL closed above the 25 week trendline support and 30 DMA.
FIB 0.786 is current resistance and price is inline with that level.
MACD is looking to move towards the positive side while RSI is also looking good.

LOFC.N - LOLC FINANCE PLCCSELK:LOFC.N0000
Disclaimer: This chart and analysis are not meant to be, and do not constitute, financial, investment, trading, or other types of advice or recommendations. Do your own due diligence before trading or investing in any stock exchanges, Indices, Stocks, Forex, Crypto etc.
LOFC
After a continuous decline from its support zone share price to a turnaround. The volume traded in last 2 market days were above the average.
Share price touched the resistance zone 5.40-5.60 and closed below Daily MA 30.
Resistance zone 5.40-5.60 , DMA 50 and trend resistance line seems to be getting in to a confluence.

BRWN.N - BROWN & COMPANY PLCCSELK:BRWN.N0000
Disclaimer: This chart and analysis are not meant to be, and do not constitute, financial, investment, trading, or other types of advice or recommendations. Do your own due diligence before trading or investing in any stock exchanges, Indices, Stocks, Forex, Crypto etc.
BRWN
Bounced from FIB level 0.786 area. There was bullish divergence in RSI and MACD indicators.
MA 30 is showing resistance and next resistance zone might be the golden pocket area.

BIL.N - BROWNS INVESTMENTS PLCCSELK:BIL.N0000
Disclaimer: This chart and analysis are not meant to be, and do not constitute, financial, investment, trading, or other types of advice or recommendations. Do your own due diligence before trading or investing in any stock exchanges, Indices, Stocks, Forex, Crypto etc.
BIL has broke its falling wedge upper trend line.
Also there was bullish divergence no we can assume that it has been validated.
It touched the resistance line created by the supporting trend line of 52 week low. and closed on it.
Overall volume wise there need to be more improvement.

Rs 53.80 to put buyers back in controlWhilst the long term trend remains very much in favor of the buyers, traders should be looking to buy strength as prices have a successful move through the AVWAP from the most recent high.
Right now, prices seem to be building up for another leg higher but our jobs is not to speculate but rather react as the market gives us good probability signals. Clearing 53.80 would put the buyers back in control and likely see prices retest the 57 - 58 area. Breaching through this would likely see a move towards the mid 65 - 67 range.

Watch out for the AVWAP from the recent highs!With solid fundamentals backing the current move in GLAS, this could just be the early phase of the uptrend. The AVWAP from the current highs is around Rs 21.10 - Buyers need to keep an eye on this level. Closing above this on high volume would likely put the buyers back in control and initiate a strong upside move.
Right now, the stock is trading above a rising 50 and 200 day MA meaning that both the medium and long term trend is very much favoring the buyers.

BOGAWANTALAWA TEA ESTATES PLC (BOPL.N0000)Entry Point: 40-42
Profit Target: 60
Stop-Loss: 37
Disclaimer: The information and analysis provided in this publication are for educational purposes only and should not be construed as financial advice or recommendations to buy, sell, or hold any securities. The author and TradingView are not responsible for any investment decisions made based on the content presented herein. Always consult a financial professional before making any investment decisions.

LIOC.N - LANKA IOC PLCCSELK:LIOC.N0000
Disclaimer: This chart and analysis are not meant to be, and do not constitute, financial, investment, trading, or other types of advice or recommendations. Do your own due diligence before trading or investing in any stock exchanges, Indices, Stocks, Forex, Crypto etc.
LIOC on 12/05/2023
01. Share price lost the falling wedge support line.
02. The long term falling wedge support is now can be acting as a support.
02. MA 200 has inclining.

SCAP.N - SOFTLOGIC CAPITAL PLC / AAIC - SOFTLOGIC LIFE INSURANCECSELK:SCAP.N0000
CSELK:AAIC.N0000
Disclaimer: This chart and analysis are not meant to be, and do not constitute, financial, investment, trading, or other types of advice or recommendations. Do your own due diligence before trading or investing in any stock exchanges, Indices, Stocks, Forex, Crypto etc.
SCAP on 11/05/2023
01. Weak bullish divergence.
02. Tested the upper level of the downward channel.
03. Candle closed just below MA 200.
AAIC on 11/05/2023
01. RSI is in a steep inclination.
02. Falling wedge upper trend line breached.
03. Good amount of volume has been traded.

SCAPtoo much resistance at 9.6-9.2 range. Also 200dma overhanging
However RSI has given an early signal.

LIOC.N - LANKA IOC PLCCSELK:LIOC.N0000
Disclaimer: This chart and analysis are not meant to be, and do not constitute, financial, investment, trading, or other types of advice or recommendations. Do your own due diligence before trading or investing in any stock exchanges, Indices, Stocks, Forex, Crypto etc.
LIOC on 11/05/2023
01. Share price is maintaining with in the falling wedge support line.
02. MA 200 has inclined from it's previous resistance 182.00

LOLC.N - L O L C HOLDINGS PLCCSELK:LOLC.N0000
Disclaimer: This chart and analysis are not meant to be, and do not constitute, financial, investment, trading, or other types of advice or recommendations. Do your own due diligence before trading or investing in any stock exchanges, Indices, Stocks, Forex, Crypto etc.
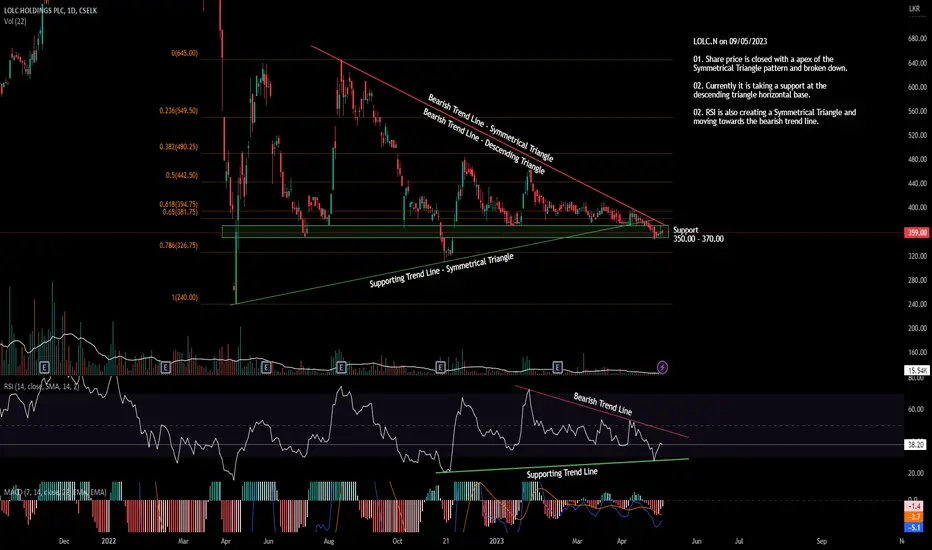
LOLC.N on 09/05/2023
01. Share price is closed with a apex of the Symmetrical Triangle pattern and broken down.
02. Currently it is taking a support at the descending triangle horizontal base.
02. RSI is also creating a Symmetrical Triangle and moving towards the bearish trend line.
LOLC.N - L O L C HOLDINGS PLCCSELK:LOLC.N0000
Disclaimer: This chart and analysis are not meant to be, and do not constitute, financial, investment, trading, or other types of advice or recommendations. Do your own due diligence before trading or investing in any stock exchanges, Indices, Stocks, Forex, Crypto etc.
LOLC.N on 08/05/2023
01. Share price is closing with a apex of the Symmetrical Triangle pattern.
02. RSI is also creating a Symmetrical Triangle and moving towards the bearish trend line.

BRWN.N - BROWN & COMPANY PLCCSELK:BRWN.N0000
Disclaimer: This chart and analysis are not meant to be, and do not constitute, financial, investment, trading, or other types of advice or recommendations. Do your own due diligence before trading or investing in any stock exchanges, Indices, Stocks, Forex, Crypto etc.
BRWN.N on 08/05/2023
01. Share price settled above the trend line of falling wedge.

LIOC.N - LANKA IOC PLCCSELK:LIOC.N0000
Disclaimer: This chart and analysis are not meant to be, and do not constitute, financial, investment, trading, or other types of advice or recommendations. Do your own due diligence before trading or investing in any stock exchanges, Indices, Stocks, Forex, Crypto etc.

ACL.N - ACL CABLES PLCCSELK:ACL.N0000
Disclaimer: This chart and analysis are not meant to be, and do not constitute, financial, investment, trading, or other types of advice or recommendations. Do your own due diligence before trading or investing in any stock exchanges, Indices, Stocks, Forex, Crypto etc.

BIL.N - BROWNS INVESTMENTS PLCCSELK:BIL.N0000
Disclaimer: This chart and analysis are not meant to be, and do not constitute, financial, investment, trading, or other types of advice or recommendations. Do your own due diligence before trading or investing in any stock exchanges, Indices, Stocks, Forex, Crypto etc.
BIL.N
01. Share price moved above the upper trend line of the falling wedge pattern and closed on the trend line.
02. MA 20 is at 5.90 and resistance zone 6.00-6.20 will be the next hurdle.

BIL.N - BROWNS INVESTMENTS PLCCSELK:BIL.N0000
Disclaimer: This chart and analysis are not meant to be, and do not constitute, financial, investment, trading, or other types of advice or recommendations. Do your own due diligence before trading or investing in any stock exchanges, Indices, Stocks, Forex, Crypto etc.
BIL.N
01. Falling wedge pattern invalidated.
02. Currently holding at the support 5.30 - 5.20.
03. RSI is in oversold zone.
04. BIL.N took support from a important trend line.

BIL.N - BROWNS INVESTMENTS PLCDisclaimer: This chart and analysis are not meant to be, and do not constitute, financial, investment, trading, or other types of advice or recommendations. Do your own due diligence before trading or investing in any stock exchanges, Indices, Stocks, Forex, Crypto etc.
CSELK:BIL.N0000

LIOC.N - LANKA IOC PLCDisclaimer: This chart and analysis are not meant to be, and do not constitute, financial, investment, trading, or other types of advice or recommendations. Do your own due diligence before trading or investing in any stock exchanges, Indices, Stocks, Forex, Crypto etc.

RICHARD PIERIS (RICH.N0000) at Strong Support ZoneEntry Point : 20 to 21
Profit Target : 32+
Stop-Loss : 18.5
Disclaimer : The information and analysis provided in this publication are for educational purposes only and should not be construed as financial advice or recommendations to buy, sell, or hold any securities. The author and TradingView are not responsible for any investment decisions made based on the content presented herein. Always consult a financial professional before making any investment decisions.
