LIOCSince the stock has not yet broken above its descending trendline resistance, it may be best to observe this counter for the time being.
Disclaimer: This chart and analysis are not meant to be, and do not constitute, financial, investment, trading, or other types of advice or recommendations. Do your own due diligence before trading or investing in this stock.

RCL | Testing 200 MAThe stock's current price is testing its 200-day moving average. If the stock price breaks above this level, it could test the resistance range between 31.5 and 32.


LIOCST Trend line broken. Prices fluctuating between 195 - 200. Has to breakout either way.
MA 20 stabilising before moving upwards. Has to hold on to MA 50,100 Support and break MA 9 resistance
Bollinger Bands flattening after narrowing for last few days.
MACD widening

CIND - waterworks
As mentioned in above chart, Cind is being rejected at marked level. But it made to breakout from a flag pattern with a considerable volume.
However, Keep an eye at given resistance zone. It could still make a bearish divergence if price appreciate abruptly.
Counter in Midterm looks much bullish, since its trading above most of SMAs 25>200
Green line is a safer entry point.

LIOC - oil oil oilLIOC is on a verge of a major breakout, prices are moving along the trendline with fib resistance at 206.75.
RSI has broken out and currently on retest while traders taking profit out. Note that all along LIOC being above MA200 is making the counter bullish in overall trend.

EMLSimple chart.. prices and SMAs are converging. A definite big move on the ways.. Mark your stops along lower trend line as well as your entries.
have at it !

LOFC While moving below all SMA, LOFC seems having good volumes coming in at current levels.
trendline supports can be seen in 5.3 and 5.0 respectively. However given the nature of the counter, below 5.0 should be the
immediate stoploss for traders who takes positions at above levels.
RSI shows about to breakout its trendline
PS - go through the chart thoroughly, i have added much information in it.

RCL - Boss of tiles RCL has broken from its falling wedge trendline (following an exaggerated divergence) and is now consolidating above SMA50,
while retesting the broken trendline.
Prices can come down up to 28.3 levels until it makes the next HH, breaking 31.3 (latest High).
Keep an eye of long consolidation of the counter, RSI trendline breakout will likley to take the prices to next stage.

PACK | Testing Anchored VWAPThe stock has created a bearish divergence on the relative strength index (RSI) by failing to break above anchored volume-weighted average price (VWAP) and Fibonacci retracement levels around Rs. 16.70 twice.
The stock cannot be considered bullish unless the previous higher high and anchored VWAP resistance levels are broken.
Disclaimer: This chart and analysis are not meant to be, and do not constitute, financial, investment, trading, or other types of advice or recommendations. Do your own due diligence before trading or investing in this stock.

HAYLThe stock has encountered resistance around the 200-day moving average and the expanding triangle pattern top. With the formation of a lower high, it is safer to set the stop-loss below the previous higher low of Rs. 73.90.
A cup and handle pattern will be created If the stock manages to break above the previous higher high of Rs. 78.90.
Disclaimer: This chart and analysis are not meant to be, and do not constitute, financial, investment, trading, or other types of advice or recommendations. Do your own due diligence before trading or investing in this stock.

EXPO - being shipwrecked?EXPO once a major index moving counter has lost a major support (170) is heading towards its next support levels (yellow fib lines)
i have used multiple fib charts to get a more accurate setup. golden pocket can be seen around 149-152 range where more buyers will rally to buy.
RSI seemed to have retested and crashed before price action came in.

VONEThe stock has been encountering resistance near the descending trendline and there may be a possible inverted head and shoulder pattern forming. As this pattern formation is still uncertain, it's best to monitor the stock closely and consider setting the stop-loss below the recent higher low of 33 rupees to limit potential losses.
Disclaimer: This chart and analysis are not meant to be, and do not constitute, financial, investment, trading, or other types of advice or recommendations. Do your own due diligence before trading or investing in this stock.


CHOTWith the stock moving above the descending trendline and breaking out of the horizontal price channel at Rs. 17.70 with above-average volumes, there is a high possibility of gaining momentum towards the Fibonacci retracement level of 0.5 at Rs. 19.50 levels.
Disclaimer: This chart and analysis are not meant to be, and do not constitute, financial, investment, trading, or other types of advice or recommendations. Do your own due diligence before trading or investing in this stock.

CTC | Stage 1 BaseThe stock has formed a stage 1 base after a long stage 4 downtrend. If the stock manages to break above the ascending triangle pattern at the 674 level, it may move towards the 781 levels to potentially retest the long-term descending trendline.
Disclaimer: This chart and analysis are not meant to be, and do not constitute, financial, investment, trading, or other types of advice or recommendations. Do your own due diligence before trading or investing in this stock.

LwLOne of sleeping giant, prepping for a big move. Dont forget the breakout and retest and bullish divergence

Lets Cap the SCAPSCAP shows strength in both in MACD as well as RSI in 1hourly format (taken due to short term fluctuations)
trendline resistance also has been broken.. 12.7-12.5 will be the next resistance zone for Bulls to be cautious of

CIND - WaterworksCIND has been rejected from the redzone as expected and might come down slightly more before bouncing back..
76-78 is a good zone for buyers to be interested on ! RSI shows bit more of a retest.!

PLRPLR was trying to breakout multiple times and time it had been nicely broken out with volumes.
RSI shows broken out as well.. Fib resistance are mentioned in charts.
however 9.0-9.3 looks like the hardest resistances to get through. Plan your exists properly ~

BFL | At the Edge of ResistanceBased on the formation of a bullish divergence on the Relative Strength Index (RSI) and the price moving along the edge of the descending trendline, the stock may be indicating a reversal to the upside.
To manage risk, it is best to wait for a breakout above the previous lower high level of Rs. 145 before taking a long position and if deciding to enter at these levels the stop-loss should go below Rs. 136 since failure to stay above these levels indicating a bearish continuation.
Disclaimer: This chart and analysis are not meant to be, and do not constitute, financial, investment, trading, or other types of advice or recommendations. Do your own due diligence before trading or investing in this stock.

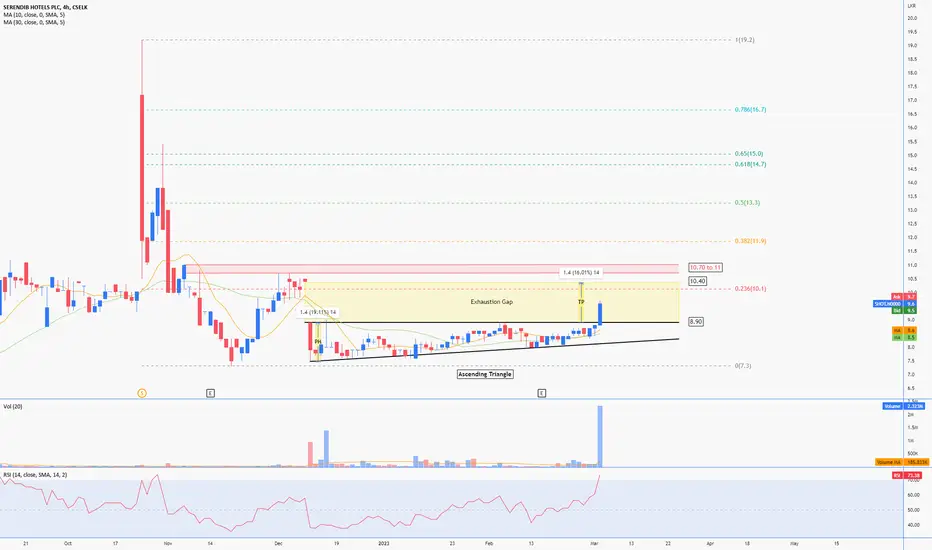
SHOT | Filling the GapThe stock has broken out of the ascending triangle pattern at the 8.90 level to fill the exhaustion gap made on 12/12/2022. With the high volumes being traded, it is possible that it may fill the gap entirely up to the 10.40 levels.
Disclaimer: This chart and analysis are not meant to be, and do not constitute, financial, investment, trading, or other types of advice or recommendations. Do your own due diligence before trading or investing in this stock.