Lundin Mining Outlook - Copper trade - Coming monthsIm getting really bullish on this stock. With a few copper mines left in the world with tiny lifespans, Lundin mining comes in with copper mines that will deliver for the next 15-20 years. Taking advantage of these high copper prices in the coming raging bull market.
If the price close above the upper resistance line then it will most likely take off. Eventually we will most likely get a pullback to make the resistance line to a support level. Im using DCA method for entry on this one.
Always make your own analysis and your own decision. Don´t see this as a financial advice. I only show you what I do. Nothing else.
OMXSTO:LUMI
CMCMARKETS:COPPERN2025
COMEX:HG1!
OANDA:XCUUSD
CAPITALCOM:COPPER

H100 Group AB - Une bitcoin Treasury : 7.7 BTH100 Group AB is a company listed on Nasdaq First North (NGM Sweden), positioned as a Bitcoin Treasury Company. Formerly known as eBlitz Group, it recently underwent a major strategic pivot through a reverse merger with Healthy to 100 AS, a company focused on health, longevity, and sustainable technologies.
Since April 2025, H100 has started shifting to a hybrid model combining:
Bitcoin holdings as its primary treasury asset,
Investments in healthtech and wellness innovation,
An aggressive fundraising strategy through convertible loans to expand BTC acquisition and fund growth.
The company has recently accumulated 7.7 BTC in a “MicroStrategy-like” approach.
Trading volume has surged since May 2025.
The stock shows high volatility, often correlated with Bitcoin movements.
Active financing through convertibles (dilution risk to monitor).
Conclusion: H100 is a speculative play on Bitcoin performance, supported by a growth-oriented vision in the health and digital assets sectors.

Ratos AB - one of my favourite chartsRatos has provided us with a golden opportunity to at least double our investment if my Elliott wave count remains correct.
After a 14 year corrective move that ended in 2020 the company value has increased impulsively - white ((1)) - and peaked in august 2021. Since then we have seen overlapping price action in what I believe is a wxy formation which recently ended in April this year. (78.6 fib retracement)
Since then price has climbed fast again which makes me believe that we start the wave 3 which potentially could stretch out to new ATHs. However, if the bearish momentum remains we could at least see the stock reach twice its current valuation.
Let´s hope for the best and keep an eye on potential pullbacks to enter long again.
P.S. If I´m not mistaken the fundamentals are also indicating a bright future for the company.

MILDEF - Take Your Seats Before the Flight🔍 Overview
- Current price: 218.6 SEK , down -1.00% for the day.
- The stock has been trading in a rising channel, but is now testing the lower boundary, indicating potential breakdown risk.
- The chart shows a weakening trend with bearish divergence and MACD crossover to the downside.
📐 Chart Structure & Price Action
🔸 Rising Channel (Bearish Bias if Broken)
- The stock had been respecting an upward-sloping channel.
- Currently sitting at channel support. A break below may trigger further downside toward 191 SEK .
📉 Bearish Divergence (MACD)
- While the price made a new high, the MACD failed to do so, indicating weakening momentum.
- The divergence was followed by a sharp drop.
🟪 Key Support Levels
- Around 204 SEK (EMA 100) and 166 SEK (EMA 200) are potential support zones.
📊 MACD Momentum
- Clear bearish crossover.
- Histogram moving deeper into negative territory = momentum shift to the downside.
- Correction for one week is highly potential.
📌 Notable Chart Labels
- “Not to miss the flight” label is for those who do not want to miss the upward move.
- “Good place to buy” and “Reduce average cost” suggest key support and buy zones in previous pullbacks.
⚠️ Strategic Notes
- Prefer partial trading, buy 1/3 with the opening.
- If price breaks below 215 SEK (support and EMA 50), further selloff toward 191 SEK is likely that will reduce average.
- If the channel holds, a bounce could occur, targeting the upper range ~ 280 SEK .
- If the channel does not hold, we will reduce average cost once more at 166 SEK . But in this case, we will also increase our target to 350 SEK .

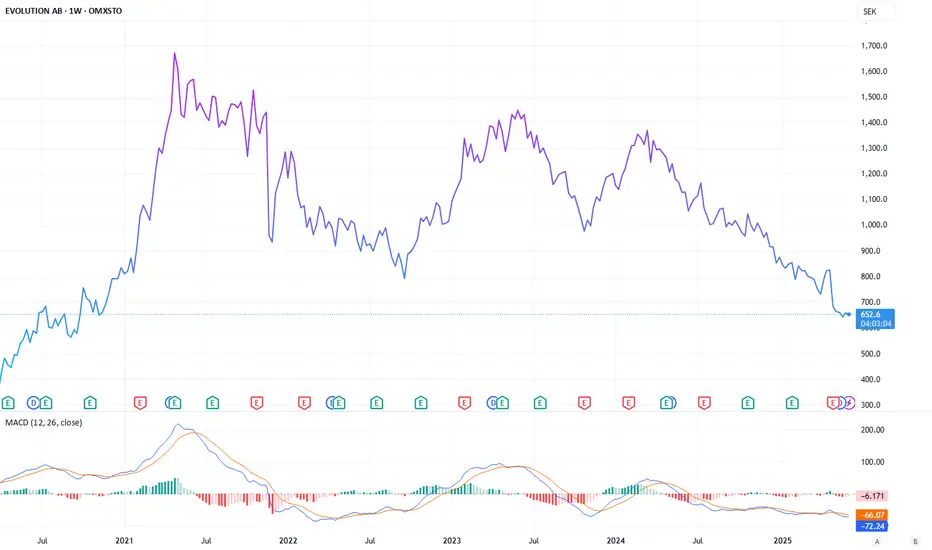
Evolution: How to Profit from Casinos Without the Risk of LosingOMXSTO:EVO CAPITALCOM:USDSEK FOREXCOM:EURSEK
The allure of casinos has always been a double-edged sword-promising riches, but delivering some risks at the same time. Yet, for savvy investors, there’s a way to tap into this lucrative world without rolling the dice. Evolution is introducing itself as a Stockholm-based leader in online casino solutions, whose recent dip in stock price has created a pretty good opportunity for those seeking both growth and income. Traded in Swedish krona, Evolution may offer a chance to diversify portfolios while capitalizing on a sector that thrives regardless of economic cycles.
Evolution’s stock has seen better days. Once soaring at 1500 krona, shares have tumbled to 652 krona, a steep decline driven by the company’s strategic pivot. As it shifts from gray markets-like those under Curaçao licenses-to fully regulated environments in Europe and Asia, Evolution is shedding its riskier past for a more sustainable future. This transition hasn’t been without pain, but the fundamentals tell a different story. With a market cap of 132 billion krona, the company boasts a net profit of 1.244 billion on revenues of 2.214 billion. Its return on assets stands at an impressive 22.9%, and return on equity reaches 30.3%, signaling robust profitability even amidst the turbulence.
For income-focused investors, Evolution shines brighter still. The company offers a 5% dividend yield, outpacing the krona’s 3.2% inflation rate, providing a real return while you wait for growth. Analysts see some serious upside, with a consensus target price of 985 krona-a potential 51% gain from current levels. Such optimism is rooted in Evolution’s dominance in live casino gaming, a sector fueled by global demand for digital entertainment. As the company doubles down on regulated markets, it’s poised to reclaim its former highs, offering a rare blend of safety and potential.
Investing in Evolution isn’t a gamble- it’s calculated bet on a proven winner. With dividends to cushion the ride and a clear path to growth, this casino stock lets you play the house’s hand. For those seeking currency diversification and a foothold in a resilient industry, Evolution may well prove to be a winning ticket worth holding.
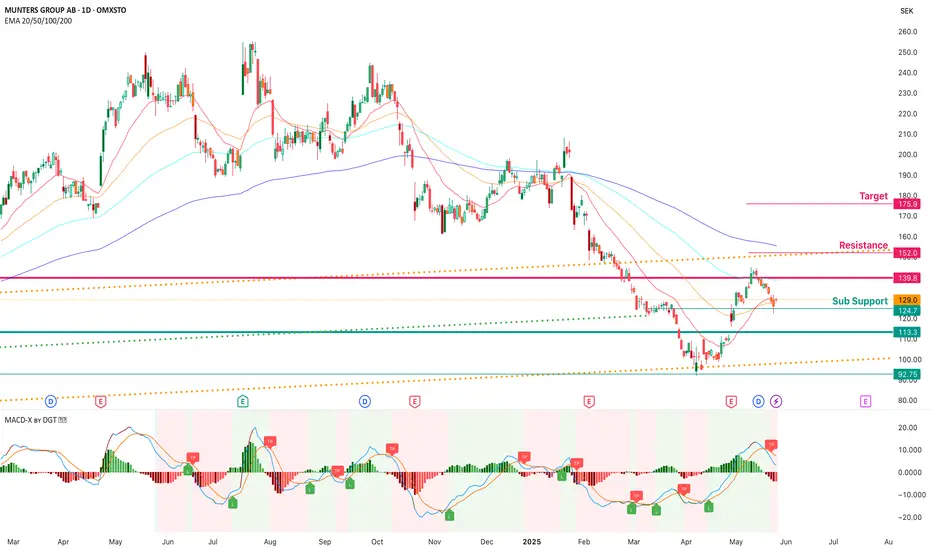
Munters – Reversal Signal in the Main Channel📈 Current Status
The stock is currently trading at 129.0 SEK.
After pulling back to the lower boundary of the long-term upward channel, the price is showing signs of recovery.
It has recently rejected resistance around 139–140 SEK and is seeking momentum to break through.
🔍 Technical Indicators and Structures
🟢 Upward Channel
The long-term upward channel, marked by orange lines, remains intact.
The price has bounced from the lower band, indicating a potential reversal.
🟠 EMA Levels
The EMA 20/50/100/200 lines are currently above the price, which still suggests a downtrend.
However, the price is testing these levels; a breakout could signal a trend reversal and present a favorable accumulation zone.
🟣 MACD
The MACD indicator has formed a bullish crossover, and the histogram has turned green → This points to increasing upward momentum.
🧭 Key Levels
Level Description
92.75 SEK Long-term channel support
113 – 124 SEK Strong support zone
139.8 SEK Main resistance level (recent average cost zone and area of price suppression)
152 SEK Medium-term resistance (upper boundary of the channel and expected EMA resistance zone)
175.9 SEK Target level (potential harmonic pattern completion and alignment of all EMAs)
✅ Commentary & Strategy
The price has rebounded from the support area but is struggling around 139 SEK.
It appears to be forming a base near 129 SEK for a potential upward move. On the daily chart, short-term EMAs are turning into support here for the first time.
If the price breaks above this zone, 152 SEK and then 175 SEK are potential targets.
If rejected, it could pull back to the 113–124 SEK support zone again.
APOTEA – Potential Pullback Before a fresh Rally📈 **Current Situation**
* The stock is currently trading at **97.96 SEK**.
* It recently peaked at **103.36 SEK**.
* After a strong upward move, the wave structure seems complete, and now a **correction** may be on the way.
---
🔍 **Technical Indicators and Key Observations**
🟠 **MACD**
* The MACD still shows positive momentum, but **signs of weakening** are appearing.
* The histogram bars are shrinking, and the MACD lines have started to cross downward → This usually signals a possible pullback.
🟣 **Formation**
* After the IPO at **58 SEK**, the stock rallied up to **97 SEK**.
* The correction after that rally ended around **66 SEK**.
* In previous waves, the price attempted to retest the highs after each correction.
* Based on this behavior, a similar retracement might occur in the current wave.
* **Fibonacci retracement levels**:
* 0.382: **89 SEK**
* 0.5: **85 SEK** → Potential support zones
---
🛒 **Buy Zones**
1. **91 – 88 SEK** → Gap area, light correction level
2. **89 – 85 SEK** → Main support zone (Fibonacci 0.382 and 0.5)
3. **80.50 SEK** → Previous resistance, now strong support
---
🛑 **Stop-Loss Level**
* A **close below 80 SEK** may invalidate the bullish scenario.
---
🎯 **Target Prices (If the Uptrend Continues)**
* **110 – 115 SEK** → New potential highs
---
✅ **Summary Table**
| Strategy | Price Range |
| ---------- | ------------- |
| Buy Zone 1 | 90 – 92 SEK |
| Buy Zone 2 | 82 – 85 SEK |
| Stop-Loss | 80 SEK |
| Target 1 | 105 SEK |
| Target 2 | 110 – 115 SEK |

Verve looking bullish !!! Verve looking bullish, If upcoming earnings goes well, we can see strong upside technically. Potential flag and pole pattern on weekly plus CUP handle pattern on monthly chart.
View is invalid if price goes below 38 SEK


5/14/25 - $yubcio - Started 1% LT stake here5/14/25 :: VROCKSTAR :: OMXSTO:YUBICO
Started 1% LT stake here
- ugh, wrote a long post and trading view glitched, and these are ultimately mostly for me, so i'm going to keep it short and highlight the points i had elaborated on
- YUBCF is the OTC ticker for US-only investors. they charge a hefty $50 fee for foreign settlements, for many investors, so be aware of this and it can affect your willingness to buy small shares. this might not make sense therefore if you're looking at only a few 100 shrs. keep that in mind
- these guys r leaders in hardware authentication. cyber has many verticals but identity is most valuable IMO and hardest to scale, esp on the hardware side (which is superior to software-only). it's just a more secure product.
- these guys will grow 25% p.a. for several years (minimally, i think), stock trades inside of 5x EV/sales, a hair above 30x PE and that, friends, is cheap.
- booking curves and wallstreet's obsession with the short term, shunning euro stocks (this is swedish) does matter for entry level. but value is good here LT.
- i plan to grow this from 1% to 3-5% depending on how the quarter evolves and whether the market dumps and this weaker beta goes bidless and i can scoop a pile 10-15% lower.
keep this on your radar.
V

Hexatronic - why I bought the stockHexatronic seems to be in an uptrend in my opinion and it has retraced very deep every single time it made new all-time highs.
In EWT wave 2s are the ones that retrace very deep and if we take into account that there might be several wave degrees with 1-2 setups it means the stock might rise to new highs again.
Considering the retracement from the very bottom of the price history is already approaching the 88.7% fib level The risk is fairly low in comparison to the upside.
Based on the assumption of several 1-2 setups that need to unfold as 5 wave cycles the company has a bright future ahead and as far as I´m aware this is shared by the fundamental analysts as well.
Please, comment if you have questions and support my idea if you like it.

Even today’s giants have at some point dropped more than 90%“Our favorite holding period is forever.”
– Warren Buffett
Even today’s giants have, at some point, dropped more than 90%.
The guru and super-investor Warren Buffett has delivered many well-known investment quotes. But the truth is that most stocks underperform the index.
Only 4% of all stocks—an incredibly small share—are responsible for the entire long-term return of the stock market.
If you look at that small percentage of stocks driving long-term returns, many of them have also fallen more than 90% from their peak at some point early in their development.
It’s very common for new technologies to get heavily hyped during the early years, only to crash when profitability fails to materialize.
What is extremely rare and unique is when a stock drops >90% and then goes on to make a new all-time high.
A rough estimate suggests that less than 0.1–0.5% of all listed stocks on, for example, the NYSE or Nasdaq, have historically managed this.
Some of those rare cases are found among the 4% of stocks that pull the market upward. Here are a few examples:
1. Apple
Fell more than 90% from its peak around the turn of the millennium (dotcom bubble).
Recovered in the early 2000s and has since increased by thousands of percent to new all-time highs.
2. Amazon
Dropped approximately 95% after the dotcom crash (from $113 to $5.97).
Reached a new all-time high around 2007 and later climbed above $3,000 before its stock split.
3. Netflix
Dropped more than 90% twice, once around 2003 and again in 2011.
Recovered each time and went on to hit new record levels.
4. Booking Holdings
Fell over 99% from its dotcom-era peak (from $990 to $6).
Recovered over several years and eventually surpassed $2,000 before the pandemic.
The crash in green energy can be compared to the dotcom crash.
Most companies dropped 90–99%, and many disappeared entirely.
A few (Amazon, Apple, etc.) had the right vision and survived. The overhyped technology combined with massive capital inflows fueled their rise.
Similarly, many companies in green energy—like Minesto—have attracted large amounts of capital from investors, shareholders, and through substantial grants from both the EU and national governments.
This led to companies being pumped up to unrealistic valuations. Without proven profitability a few years after the hype, nearly all have fallen over 90%, and some have vanished from the market entirely.
Even though things look bleak for green energy—and Minesto in particular—there are strong similarities to today's giants like Amazon, Apple, Netflix, and others.
If you compare Amazon to Minesto, Amazon fell -95.12% from December ’99 to October ’01.
Minesto has dropped -96.39% from its peak in July 2020 to April 2025.
What would it take for Minesto to stage a similar comeback as Amazon?
Those who managed to recover after the dotcom crash had four things in common:
Amazon
Technological edge – Amazon had a scalable platform.
Financing – Survived a capital drought.
Timing – A new internet breakthrough around 2005–2007.
Patience from the market – The stock remained dormant for a long time.
Minesto
Technological edge – Unique technology for harvesting energy from underwater currents.
Financing – Requires strong support and investment appetite (both public and private).
Timing – The green transition and the EU’s energy shift between 2025–2035.
Patience from the market – Investors must be willing to wait several years.
What’s the difference between Amazon and Minesto?
The internet market was digital and could grow exponentially with nearly zero marginal costs.
For Minesto, scaling is much harder as it requires heavy infrastructure, long lead times, and significantly more capital.
However, once a solution like this gains commercial traction in the green energy sector—when the technology is proven and recognized as a crucial component in the energy transition—the returns could be massive, just like they were for today’s giants such as Amazon.
Warren Buffett’s well-known investment advice, mentioned at the beginning, applies only to a very small subset of stocks.
And more likely than not, it means that as an investor, you will need to endure a drop of more than 90% before witnessing the company evolve into a giant within its sector.


Title: Against the Grain: Exploring the Contrarian Investment CaContrarian investing involves deliberately going against prevailing market sentiment. It's about identifying potentially undervalued assets that the majority of investors might be overlooking or unduly pessimistic about. In the world of heavy industry and commercial vehicles, Volvo Group (AB Volvo) – the manufacturer of trucks, buses, construction equipment, and engines, distinct from the passenger car maker Volvo Cars – presents an interesting case study for potential contrarian investors. While facing headwinds common to cyclical industries, several factors could make Volvo Group an attractive proposition for those willing to look beyond short-term concerns.
Why the Market Might Be Hesitant (The Prevailing Sentiment)
To understand the contrarian case, we first need to acknowledge why the broader market might be cautious about Volvo Group:
Cyclicality: Volvo Group's core markets (trucking, construction) are highly sensitive to economic cycles. Fears of a global economic slowdown or recession often lead investors to sell shares of cyclical companies like Volvo, anticipating decreased demand for new trucks and equipment.
Electrification Transition: The shift away from diesel towards electric and potentially hydrogen-powered commercial vehicles is a massive undertaking. It requires significant R&D investment, new manufacturing processes, and faces challenges like charging infrastructure and battery costs. The market may worry about execution risks, high costs impacting profitability, and competition from both established players and new entrants (like Tesla Semi).
Geopolitical and Supply Chain Risks: As a global manufacturer, Volvo Group is exposed to geopolitical tensions, trade disputes, and potential disruptions in complex global supply chains, which can impact production and costs.
Intense Competition: Volvo operates in highly competitive markets, facing strong rivals like Daimler Truck, PACCAR (Kenworth, Peterbilt, DAF), Traton Group (Scania, MAN), and Caterpillar in construction equipment.
The Contrarian Argument: Why Volvo Group Might Be Undervalued
A contrarian investor might look past these concerns and focus on Volvo Group's underlying strengths and potential catalysts:
Market Leadership and Brand Strength: Volvo Group holds strong market positions globally, particularly in heavy-duty trucks (with brands like Volvo Trucks, Mack Trucks, Renault Trucks) and construction equipment (Volvo CE). The Volvo brand is globally recognized for quality, safety, and reliability, commanding customer loyalty.
Proactive Electrification Strategy: Far from being a laggard, Volvo Group has been quite proactive in the transition to zero-emission transport. It is already delivering series-produced electric trucks and construction equipment and is investing heavily in battery technology and fuel cells (e.g., through its cellcentric joint venture with Daimler Truck). A contrarian might argue the market underestimates Volvo's ability to navigate this transition successfully, leveraging its existing scale, dealer network, and customer relationships.
Strong Service and Aftermarket Business: A significant portion of Volvo's revenue and profits comes from services, spare parts, and financing. This aftermarket business is generally less cyclical and more stable than new vehicle sales, providing a resilient income stream even during downturns.
Financial Health and Shareholder Returns: Historically, Volvo Group has demonstrated robust financial management, generating solid cash flows and often rewarding shareholders with attractive dividends. If the stock price is depressed due to cyclical fears, the dividend yield could become particularly appealing, offering income while waiting for a potential market recovery or re-rating.
Potential Undervaluation: The core of the contrarian argument often rests on valuation. If market pessimism has driven Volvo Group's share price down excessively relative to its earnings, cash flow, book value, or future prospects, it could represent a value opportunity. Contrarians believe the market may be overly focused on short-term cyclical risks, ignoring the company's long-term strengths and resilience.
Infrastructure Spending Tailwinds: Long-term government initiatives focused on infrastructure renewal and development in various parts of the world could provide a sustained tailwind for Volvo's construction equipment division and, indirectly, for its truck business.
Risks Remain
It's crucial to remember that contrarian investing is inherently risky. The market's pessimism might be justified. A severe global recession could significantly impact Volvo's earnings. The transition to electrification could prove more costly or difficult than anticipated. Competitive pressures could intensify further. Therefore, thorough due diligence is essential.
Conclusion
Volvo Group (AB Volvo) presents a potentially compelling case for contrarian investors. While facing legitimate concerns related to economic cycles and the complex transition to electrification, the company possesses significant strengths: market leadership, a strong brand, a robust service business, proactive steps in electrification, and potentially an attractive valuation if market fears are overblown.
For investors with a longer-term horizon who believe the market may be too pessimistic about the prospects for heavy commercial vehicles and construction equipment, and who trust in Volvo Group's ability to navigate the ongoing industry transformation, the stock could warrant closer examination as a potential contrarian opportunity. However, as with any investment, especially a contrarian one, detailed analysis of the company's financials, strategy, competitive positioning, and current valuation is critical before making any commitment.

Storytel B(Sweden Stock) Analysis-2I have analyzed Storytel stock on 16-March and published it. It is in strong uptrend. Long term target is intact. It will easily come till Target of 145.

Advenica AB (Sweden Stock)I have analyzed Advenica stock on 9th March and publish it my handle with two target(22,25). Today it hit 20.7. And its both target will come in future. Still it is in uptrend.

Volvo_B Analysis(Sweden)It is looking weak now. I have used Trend, chart pattern & other analysis and came to this target. Results is there in the next week.

ATCO_A Stock Analysis(Sweden)I have analyzed Atco_A Swedish stock and found that it at crucial junction. Although it is in downtrend. But if it will close below 163 then it go till 140. Stop loss will be 173(Max 176).

Storytel AB(Swedish Stock)I have analyzed Storytel AB stock and found that it is in uptrend. I have used Gann price pattern & it's trend. Then found these target in upcoming time. These target are for medium term.

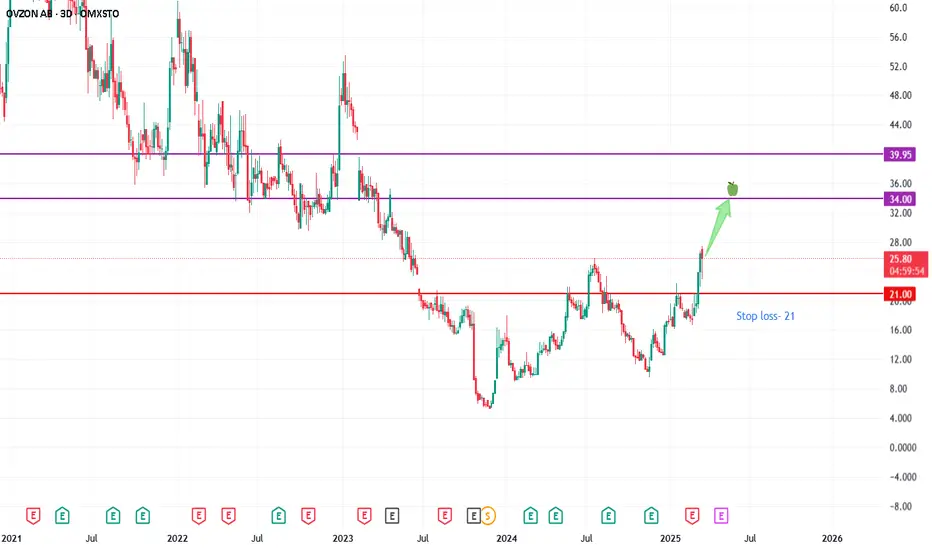
OVZON AnalysisI have analyzed Ovzon Swedish stock for short term. I have used trend, candle patter & Gann system. I have mentioned Target and stop loss.
SANIONA AB Analysis for short termI have analyzed Saniona AB(Swedish Stock). Stock has consolidated and started its upward move. I have analyzed using trend, Chart patter & Gann system. I have shared the target and Stop loss also.

ABB - much needed consolidationABB - after years of steady rise it is time to correct the wave 3 (red count)
This will give investors who believe in the company a good opportunity to get more shares at a discount price.
I predict that at around 440 - 500 SEK the stock will continue to rise in valuation with a potential of about 50% increase before starting the next correction (wave 4) as part of the green wave degree.

B3It has not yet managed to break its downtrend. It will probably stop at the green box and if the green box cannot support it, it could drop to the blue lines in the long term. But in the short term, it has a small resistance at the red lines and it could go lower as long as it is not broken.
