SANIONA AB Analysis for short termI have analyzed Saniona AB(Swedish Stock). Stock has consolidated and started its upward move. I have analyzed using trend, Chart patter & Gann system. I have shared the target and Stop loss also.

ABB - much needed consolidationABB - after years of steady rise it is time to correct the wave 3 (red count)
This will give investors who believe in the company a good opportunity to get more shares at a discount price.
I predict that at around 440 - 500 SEK the stock will continue to rise in valuation with a potential of about 50% increase before starting the next correction (wave 4) as part of the green wave degree.

B3It has not yet managed to break its downtrend. It will probably stop at the green box and if the green box cannot support it, it could drop to the blue lines in the long term. But in the short term, it has a small resistance at the red lines and it could go lower as long as it is not broken.

24SEVENOFFICE GROUP AB(247) ANALYSISI have analyzed 24SEVENOFFICEGROUP AB(247) using trend, chart pattern & Gann method. It is in uptrend. All green apples() are various targets. And those target will come in future. It is Swedish stock. Short term targets and long term targets are mentioned.

Prolight Diagnostic(PRLD) AnalysisI have analyzed PRLD using the price action , trend analysis & Gann price method. It is is uptrend. I have shared the targets in purple lines(T0,T1,T2,T3). Stop loss is mentioned.
It is Swedish stock.
I am available on X as "SKUMARINSWEDEN"

Advenica AB AnalysisI have analyzed Adevenica AB using the Price action, trend analysis & Gann method. It is in uptrend. I have mentioned the two targets. 18 is the price it has to cross comfortably.
I am available on X as "skumarinsweden"

Bra gap men riskyyyWhen you invest, you make choices about what to do with your financial assets. Risk is any uncertainty regarding your investments that has the potential to negatively affect your financial well-being.

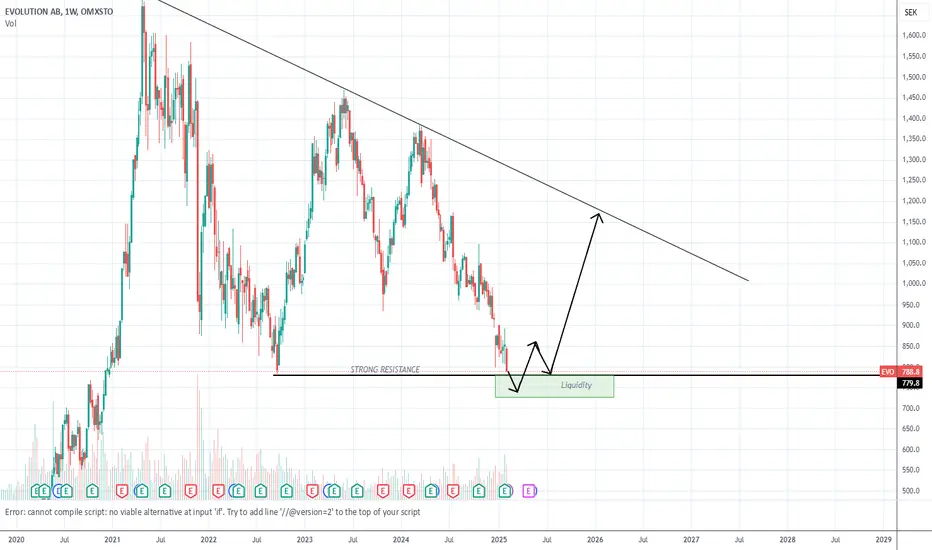
EVOLUTION A/B in demand zoneFor all those interested in the stock we seem to be at a major support. We already bounced once of this area quite a while ago. Currently there are no high-conviction signs of strength on the daily or weekly chart. What can be observed is a bull divergence on the daily on RSI. Trading volumes are trending up, very slightly. For those with more patience I would watch 620 and 550 levels.

BullishEVO is going below strong resistance, then gaining liquidity and moving up. Fundamentally, it is a very good company with a ridiculous price.
Swedbank Just Did Something It Hasn't Done in 18 Years!Hi all,
A few weeks ago, at the Estonian finance conference, I pointed out that Swedbank needs a Monthly candle close above a historically significant level to confirm further upside into "open waters".
Before I dive deeper - if someone still claims that "price has no history" or "price doesn't repeat itself," just show them Swedbank’s chart. Back in 2007, Swedbank attempted to break the 215–228 SEK level for the first time. The result? A complete failure. Sellers took control and smashed the price down.
Fast forward 7–10 years: “Let’s try again a few more times!” Still nothing. The level remained unbreakable, draining all momentum. Over the past 18 years, this zone has been tested 7–9 times, and every single attempt ended in failure.
Now, today, things are changed. Today, we have that Monthly close, and the price has now entered a potential buying zone. Technically, Swedbank is ready - optimal zone 215 to 237 SEK!
Do your homework; this is just my opinion and my analysis!
Do not forget to "Boost" the idea - all the best,
Vaido

$SVED Market UpdateOn the 4H timeframe, the trend has shifted bullish. The stock pulled back on Friday, but it did not close below the demand zone, which was previously a supply zone.
On the weekly timeframe, there is massive trading volume between 44 and 46, making these levels key areas to watch. The stock could either break through and continue making new highs, stall, or reverse from here.
⚠️ What happens next depends on the new trading volume at these levels. However, one thing is clear, a weekly candle rarely lies, so keeping an eye on this range is crucial.

Embracer Group - extreme longAbout the company:
Video Game Developer based in Switzerland.
Chart:
. strong long signal
- great stock for my opinion

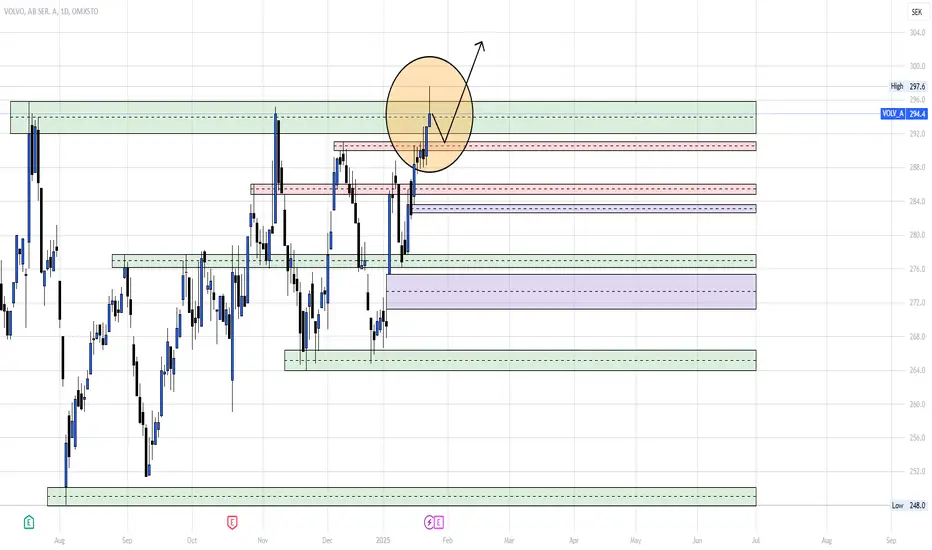
WAIT BEFORE YOU BUY VOLVOHere on Volvo, we have a long position entry, however, since the price now is stuck in a strong liquidity zone that it pulled back on for multiple times, we won't risk and enter, unless the price broke through it to make our entry the pullback on the price.
Follow for more!
BUY ATCO_AOn ATCO_A, you can see that it started going higher and higher, again after the brake it did after swipping the liquidity at 170.65, to give us a confirmation of the bullish movement.
Now for those who bought, you can watch how the price reacts in every levels in between the 1st and the 3rd target before reaching the main one which is at 220.3.
Follow for more!

BUY INVE_AOn INVE_A, you can see that the price is showing a great potential to go higher especially after the last LQ sweep we got and now it started pushing towards the level 355.0.
If you're welling to buy, or you already bought and you don't know which level exactlt to target or where to close, now you got the answer to it!
Follow for more!

EVO looking good for long termWe have a huge double bottom
Weekly bullish divergence
And oversold RSI
Looking brighter than trump's hair

APOTEA - ReversalTargets and secure buy levels
Reverse Head and Sholders and Fib 0.5: 83
Fibo 0.6: 84
Q4 will be released on 6th of February.

YUBICO - Time to say byeThis analysis cannot not recommend OMXSTO:YUBICO as an investment stock with this price level.
Overview of the Company
The company operates in the cybersecurity category (actually, what it does is not traditional cybersecurity services, we may call it as information security or data security).
They produce a single device used for authentication (web, mail, door etc.). However, the increasing number of passkey-based authentication (biometric, camera or pin-based methods) in today's computers is the biggest competitor of this system. Because such services come free with the device you buy.
Current Price : 216
Moving Averages
Daily 200 : 232
Prices broke 200-day support on 3rd of January.
Price under 200-day daily is a very strong indication that the stock operates in down trend
Weekly 50 : 219
Prices broke 50-week support on 7rd of January
Waves
If the pries goes under 204, it confirms the downtrend.
One another support is on 176 that looks a senseful price to have this stock for long term.
Candles
Monthly : Most recent two candles is making lower low with a high volume that is an indication of a downtrend.
Indicators
MACD Weekly : Growing histograms under base level indicates sell pressure.
MACD Daily : Formation of a divergence started that indicates price reversals.
MACD 4H : A divergence has been formed, but histograms are very short that may indicate a noise.
MACD 1H : If prices does not go under 216, it is a signal to buy (short term trade as well as a week signal)
Super trend :
1H - 4H - 1D : Downtrend
PSAR :
1H : Uptrend (weak)
4H - 1D : Downtrend
Harmonics
A harmonic pattern has been formed with a good wave structure.
The harmonic has been supported by support and resistence lines.
But the price operates under harmonic pattern level that is an indication to stop out.
When the price hits 211, the formation fails.
Fundamentals
Valuation :
P/E : 54 (Very high)
Price to cash flow ratio : 95 (Extremely high)
Summary : Very high price
Profitability
Gross margin : 80% (Significant)
Net margin : 13% (Good)
Summary : Profitable
Solvency :
Debt to equity : 0.04 (Significant)
Summary : Finances itself without debt
Earnings :
Fluctuates, reduced -18% at Q3
Insider activity
Only selling for 1 year with no buy
Fond activity
Selling

Wall_B Long There is a divergence in the RSI and it is currently at a strong support. It may gain momentum upwards from these prices. Entry 45, Target 1:48 and Target 2:52 stop-loss: 44

APOTEA - Low probability for a short term Apotea is willing to visit lower levels as much as it can.
It can be an opportunity to buy.


BONEX - Trending independently from the marketOMXSTO:BONEX has drawn its own trend independent of the market.
The possible buy area we determined is on the chart.
Caution: A stock has risen slowly but without correction
Note: It may not make sense to chase counter trades in such a strong trend.

APOTEA - Pull back and continue upwardTwo tops created a resistance.
A correction to 84 - 82 levels is expected to be a good PRZ correction.
OMXSTO:APOTEA is looking forward to announcing the first financial statements.
