

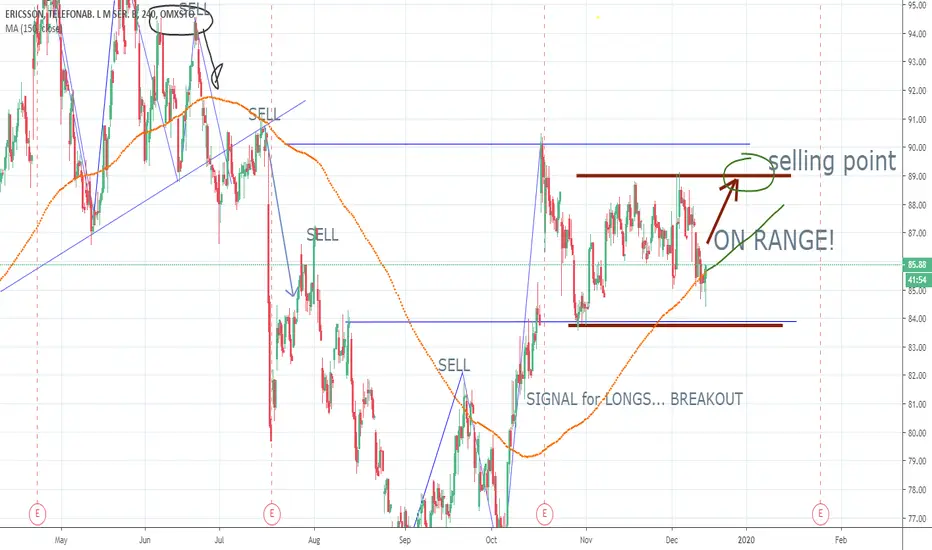
ERIC B in rangeWait to came back to 89 SEK to selling or wait for a possible breakout to major levels (so risky today).


Let's buy paintI-tech seems like it has reversed it's trend. Volume climax to the downside was bought up quickly (probably early investor who sold) and wave 2 text-book bounce on the .618 fibonacci. Start to scale in now or wait for Wave 4 (ABC) to play out. Could do 3x in one 8-12 months. Trade setup is invalid under Wave 2.

VolvoExpecting orange to break. If it holds holds and comes up towards first and second red, i will short it. Stoplose above swing high.


Stock RSI indicates on hour-lapse strong buy signalStochastic RSI and Support resistance shows a strong buy move.
1Hour trend, LONG idea


Swedbank Stockhom 2020 BullEven if the punishment for old sins turns out to be a hard one (we don't know and it may turn out to be less harsh), I expect a positive direction on Swedbank with a target of 150-ish by February 2020.

Several Support lines + RSI - Bullish+4 Supportlines under the graph that have been tested but not broken.
RSI indicates oversold.

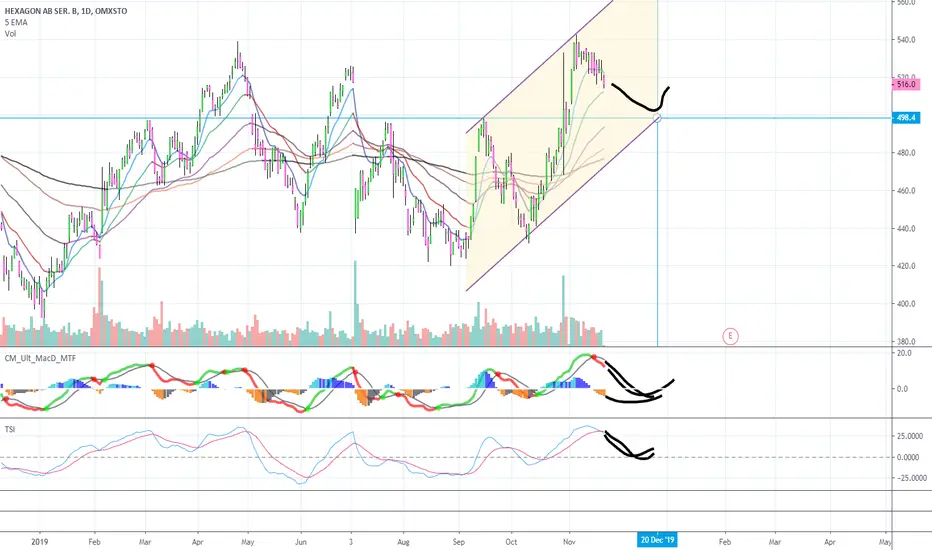
HEXAGON Stockholm bearHexagon B on Stockholm exchange has seen long period of success which may continue after a small correction. Bear for me here


SEB (SEB_A) | Money-Laundering Concerns! Keep an eye on ~60!Hi,
Shares of SEB' AB (Skandinaviska Enskilda Banken AB provides corporate, retail, investment, and private banking services in Sweden and internationally) fell by more than 14% (on Friday) as investors worried that another Nordic bank will be dragged into the scandal over money-laundering. It is hard to say, how the following weeks/months may affect the SEB price (investigations are ongoing) but anyway, I would like to point out a technically strong price level which should play an important role in further price action.
Currently, I can only recommend - stay away from it. The price can get more hits during the investigations, especially when these stories get firmer confirmations.
To talk about that price level - my eyes are pointed around 60. It needs to fall another ~25% to the mentioned level and definitely, it is doable. I don't want bad but as an investor and trader, I'm looking forward to this level because technically, it is a pretty strong and clean one.
Two other major Scandinavian banks, Swedbank and Danske, had already been subject to major investigations in large-scale money laundering activities and I would like to share a comparison with Swedbank, who has already gone through it (almost):
As you see, the historical similarities have been pretty amazing. Now, we can take this Swedbank price movement as an example (Swedbank price is the orange line) and it is pointed also to my mentioned "keep-an-eye" level 60. Let's count the other criteria which should act as support levels:
1) Okay, the comparison with Swedbank is pointed to the marked area.
2) 2000/01, 2011 clean resistance levels start to work as a support level.
3) The middle number 60 itself should work as a tiny support level.
4) Channel projection bottom trendline may push the price upwards from the green area.
5) Different Fibonacci Extensions are adding strength to the shown area.
6) Fibonacci retracement 50%. Pulled from 2009 low to 2015 high.
7) AB=CD
8) If the price reaches to the shown area, then it has fallen from the 2015 high at 111.50 to the ~55, which is 50% from the recent high and pretty often stocks make a bounce after they have fallen approximately 50%. So, it matching perfectly with our mentioned area.
9) Obviously, perfect would be a bullish Weekly or Monthly candlestick pattern formation around the green area!
Summary: As said, stories around the SEB' stock are serious which makes this stock extremely risky to invest/trade at the current price levels.
Be patient, wait for conclusions and if the conclusions are enough for you to be satisfied (after the price has reached ~60) then this could be a perfect spot and timing to invest or reinvest to SEB'.
What if it doesn't reach to the mentioned area? Nothing(!), the situation around Nordic banks is highly risky and I search only high-probability investment setups, not the mediocre ones. Mediocre setups can easily damage my success rate, especially under such conditions.
If it was helpful then take a second and support my effort by hitting the "LIKE" button, it is my only fee from You!
Regards,
Vaido

Sweet buying spot for Soltech Energy Sweden?It could go all the way down to the bottom of the channel to 17.9 SEK in the next weeks but if the bottom of the channel holds it would be a good buying spot if it rises to around 19-20 SEK in my opinion.

Possible breakout of down trend in December/JanuaryBreakout in the Swedish automotive supplier Bulten


Mekonomen SE bull targetMekonomen on Swedish exchange. Nice results. Good company which delivers solid results. Quite high historically but another bull run if we bounce inside the trading channel. Supported by lateral RSI, positive TSI and MACD. Target 95 SEK mid-December 2019. On the other hand, if we break under the channel, probable sideways move well into January 2020.

