Triangle formation Immunovia- BLUE - Possible stock price improvement, based on the theory of triangles.
- YELLOW - Triangle hypotenuse that can't be crossed if formation is to be completed.
- RED - Triangle roof that can give a buy signal if crossed.
Wanted to share with you what I found in the chart. This is not a advice to invest. Plz comment if you disagree or want to add something :)

A small share but a potential big futureOssDsign received a hard reception on the stock exchange, but now it seems, after a long period of time, that the panic has gone a long way.
The stock is in an upward trend and has been doing so for some time, but will it continue? I personally have a high expectation of self-esteem, and have been involved in the IPO.
What is OssDsign
The ultimate goal in reconstructive CMF surgery is the restitution of a skeletal defect by the patient’s own bone with maintained structural stability. At OssDsign we fulfil this goal by combining a unique calcium phosphate material and innovative titanium-reinforced design with precise patient specific 3D printing.
UNIQUE IMPLANT PROPERTIES
OssDsign’s proprietary titanium-reinforced calcium phosphate implants are designed with the intention to eliminate the well-known lifelong risks posed by commonly used inert materials or autologous bone. Clinical experience shows low rates of complications and evidence of new bone and blood vessel formation.
CUSTOMIZED PATIENT-SPECIFIC DESIGNS
Every implant is tailored to the individual patient’s defect and anatomical requirements using CAD technology and 3D printing. A high level of clinical design competence enables us to satisfy customer and patient needs, even in the most complex cases.

SAAB is not getting any loveThe main focus is as the comment describes:
"Testing weak support for the fourth month in a short period of time,
if it breaks I expect a move down to around ~ 260."
The second most important thing to be looking at is that it never really recovered from december lows, while the rest of the market went mooning to new heights.
Entering half of my intended position on monday, rest if monthly closes below 50 day MMA.

Spectracure - Double top and RSI divergence shortSpectracure - Double top and RSI divergence
short for 27.6 area

Vitrolife ends ABC pattern? After a clear EW formation and looking to see if a new wave will start. Close to MA200 and tested support on Fib 38%.


SALT_B LONGIn at 5.02
SL: 4,27
AVG down in 4,5 range
Increase size if close above 5.4
TGT: 8-10 sek in 1-2 months


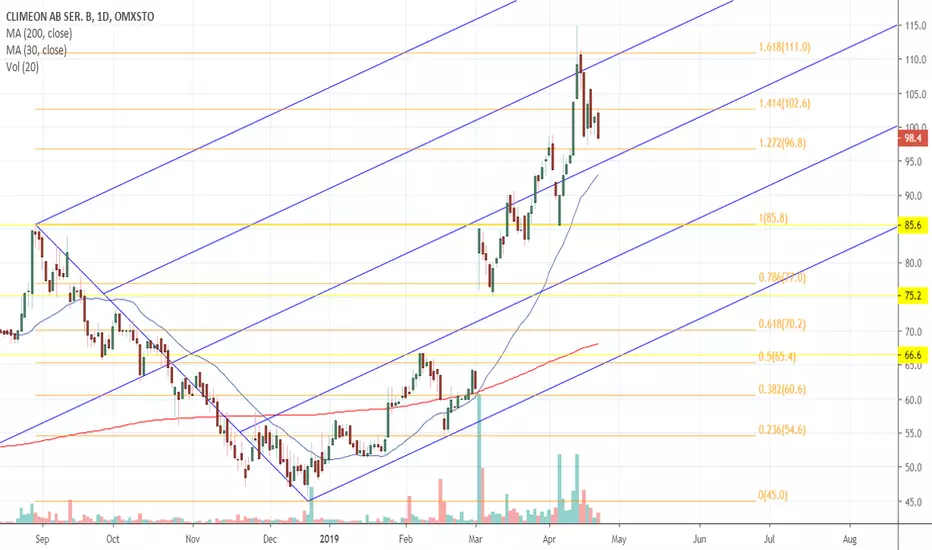
Climeon neutral short termNeutral in the short term but positive to the technique the company employs have taking waste heat and reutilising the energy.
Neutral short term ( 1-2 months) Long term long


Lucara DiamondNeutral until it breaks downward trend could go lower
Possible double bottom in?
6.5% dividend
Future demand from millennials is minimal as they are attracted by the prospect of cheaper stones generated in a lab that are guaranteed to be conflict-free.
store of value in trouble times. no! precious metals are probably a better investment as diamonds are subjective to the people who bought them.

soon its time but not yet , simple story as always .. x stock dropps little and john steps in to buy . john always to early , who has biggest patience gets best reward . technicaly breaking TL = SIGNAL TO REVERSE . TL IS BEEN UNDER BUILDING . so patience and eyes open , because soon its time to step in

STAR_B, possibly a huge gainer for the rest of 2019 - into 2020With a stoploss at daily triplebottom around 0.75 and W5 tgt: at 4SEK, risk/reward here is great!
Owning this stock since 0.9

Long DOMAt the bottom in an upcoming channel. Strong signal when touching the lower channel today. Very nice candlestick today in my point of view :)


Idea for the coming 2 weeksHopefully, the report on may 14 will give a jolt back into the long trend channel, perhaps a good report will take it even higher.

FING-B - VERY BEARISHI saw a post this morning on a Facebook post suggesting traders long here so I decided to develop my own chart. I find many traders miss out on a critical point of analysis when trading; what is the current trend? Hint: you cannot find the current trend from any time frame below the daily...
My play here would be to short anything below 11, s/l at 12, and a t/p at 5: risk reward 6:1.
Regardless I would suggest looking for alternatives as the majority of good short entries have now gone.
Blue triangle indicates the current range.
Green box is buy.
Red box is sell.
Green & Red lines indicate t/p.
White lines are fib channels.
White dotted lines are fractals.
The arrows indicate the overall trend.
This is a log chart.
This is not financial advice. All charts shown on my page, including this one, are just for fun.
If you enjoy my ideas please give this post a like and follow my page if you would like to see future posts! :)

Paradox Interactive - great company, sold for weak SEKI'm a big fan of theirs and from the looks of it they're going to release even more great games while keeping the cash flowing off DLC for older titles.

SWED-A - dividend yield already great, could be hit with newsI've already bought some and am going to hold on for a long time. Swedbank makes like 20%+ off their capital in my home country. It's a disgrace : )
