
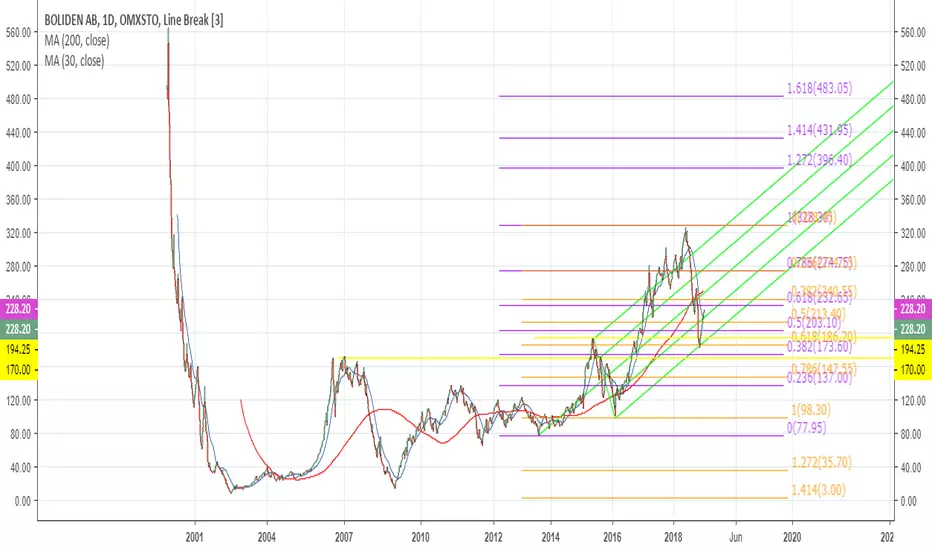
Boliden From a positive optimistic view these is definately a view with a little volitility inbetween for Boliden to reach 326 again and have a tight stop in around 300 over the next 3-6 months
+ global copper market was in a deficit last year.(2018)
* Bounced of lower level support..
* good dividend
* dollar weakness
* Electric car demand--
*- Chinese economy weakness
*- Dollar strength
* The Bubble that is supposed to deflate/pop
The market is unsure? So a small post to begin with...or are we reaching the blow of top where commodities outperform.. starting to think more towards the later...keep it tight if it drops...choose your own levels...
Boliden+ global copper market was in a deficit last year.(2018)
* Bounced of lower level support..
* good dividend
* dollar weakness
* Electric car demand--
*- Chinese economy weakness
*- Dollar strength
* The Bubble that is supposed to deflate/pop
The market is unsure? So a small post to begin with...or are we reaching the blow of top where commodities outperform.. starting to think more towards the later...keep it tight if it drops...choose your own levels...

Bouncelong into shortLong bounce into short, stoplose under swinghigh with longterm targets futher down.

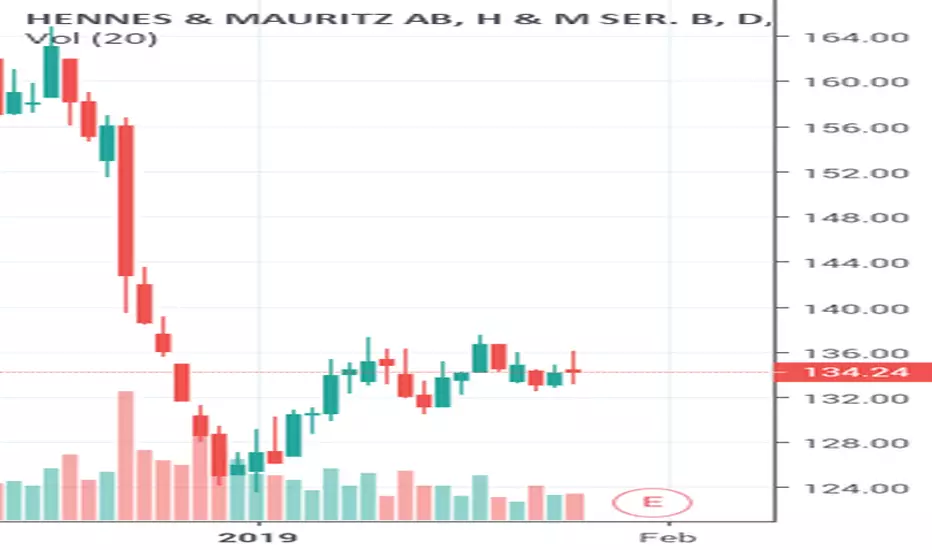
H&M is ready for sellGood day, I think 136 is a nice place to sell from.
Check my twitter and found something useful!
SwedbankHello, this is my second trading idea posted here on Tradingview. I have marked out my ranges, 1-4 small and 1-4 big. Swedbank is already above my "big range" and I think 1-3 small step is done.
I have waited a few weeks to open this trade and last Friday I took it on. I'm shorting this with warrants as usual as it gives me a fixed risk. I did't want to use date warrants for this, however the recent price is changed and it may be worth a shot. In this case the market is pricing Swedbank at 174kr 6 months away and 162kr 11 months away. (Let me point out prices have been adjusted since last time I checked and prices are more fair now after the recovery of stock price 12 % gain in 2019 192kr-214kr. So there could be a possibility to use date warrants after all.
A few weeks back I followed the market-makers pricing "date warrants" of this stock at 150kr and below when stock was still 190+ If the global indexes should be weakening going forward, specially euro zone I believe this stock could be heavy and potentially drop a bit. If I should add to current position I will use date warrants for that.
Please let me know what you think. Thanks
This is just an Idea of mine and no recommendation


Strang triangel paternt to up side on daily and intraday next Strang triangel paternt to up side on daily and intraday. Next stop on hole number 150
stoplos at 139
Look fore a buy on a Head and shoulder the en of this yearLook fore a buy on a Head and shoulder the en of this year

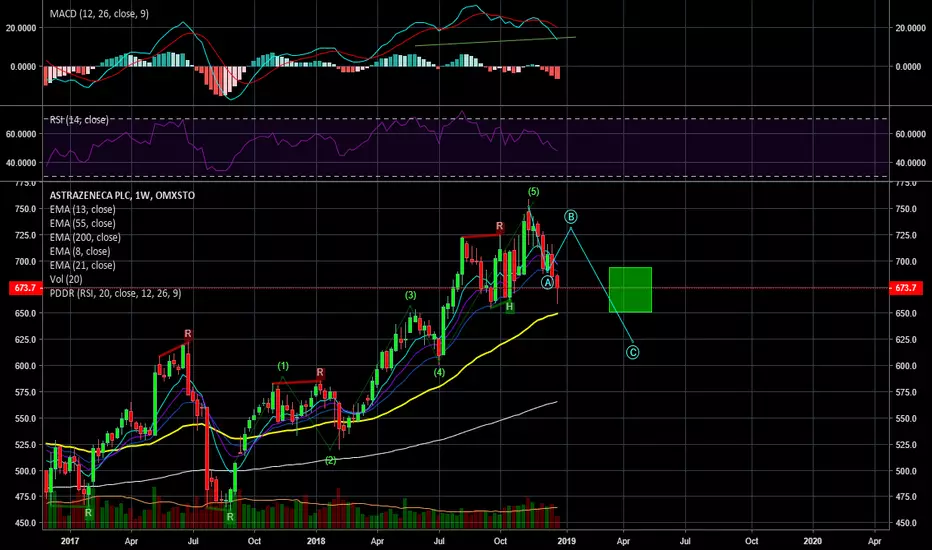
Its the matter of how you countI originally counted the waves like this, and there was no divergence on RSI or MACD


GOMX Breakout on 4 h - Confirmed GOMX just got a confirmed breakout on 4 h chart. We got an "inverse emprire" and "green candle reversal" on price action as well as a double divergence on the MACD .

Breakout on [GOMX] - unconfirmedGOMspace seems due for a another breakout. We just hit an extended FIB move to 1.2, stochastic seems ready to cross.... I am expecting a breakout (unconfirmed)! Keep your stop loss tight and remember to take profit.

Different scenariosI think this graphs shows the situation which we are in. I originally thought that the fifth wave was over warlier when we hit just over the 1.618 making it the perfect fib ratio. However, the last wave up surprised me. So I considered that maybe we witnessed a b wave correction inside the ABC whih goes over the previoues wave up. However the scenario wasn't convincing. So I assumed we are in the fifth wave up.
Another scenario I analysed was foe another wave up remaing in the fifth wave, however looking at the RSI level divergence that seemed less likely too.
Therefore, my current theory is that we have now wtnessed a complete wave up, and the wave A in the correction. Therefore the play i suggest is to wait for the completion of wave B, and then short the stock for the Wave C

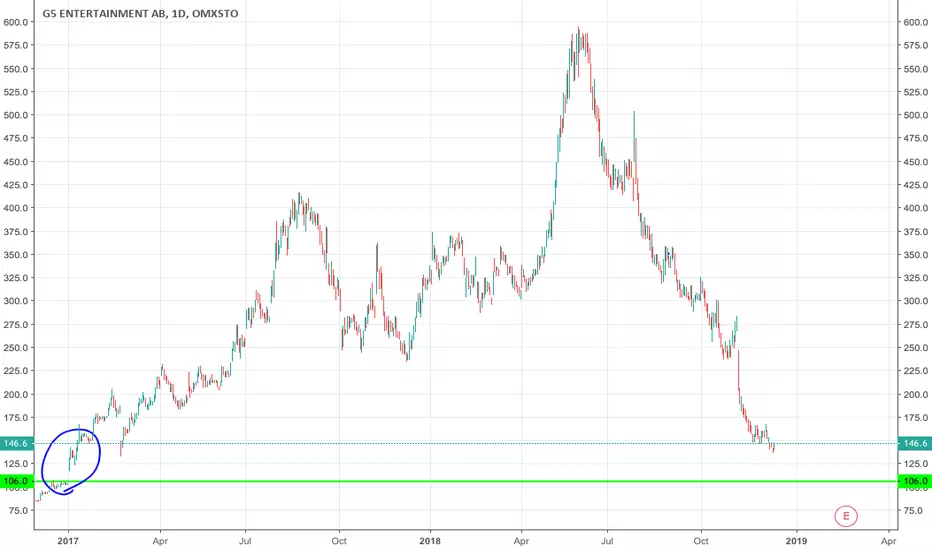
GAP in G5 The trend is negative and I don't think the trend will reverse until the gap is filled. There is a gap around 250 but I don't think it will be filled because the backside of the gap is very close to the gap.
#TRADE 1 - Bakkafrost, positive trendlineIt's Christmas time and that mean high salmon prices. Furthermore we have a nice positive trendline which indicates a stabile industry in these highly volatile times.
Please don't forget to give a like if you appreciate this :)


Nordea near i support areaNordea has fallen a bit in the past one reason is that they have moved their HQ to Helsinki witch the stockholders don't seem to like.

