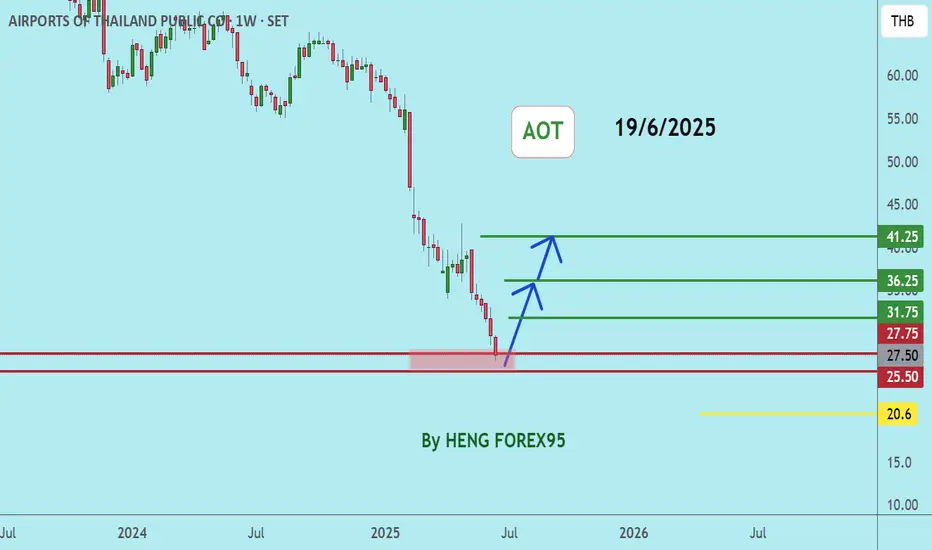
AOTAOT price is now near the support zone of 27-25. If the price cannot break through the 25 baht level, it is expected that the price will rebound. Consider buying in the red zone.
🔥Trading futures, forex, CFDs and stocks carries a risk of loss.
Please consider carefully whether such trading is suitable for you.
>>GooD Luck 😊
❤️ Like and subscribe to never miss a new idea!
NEX, BYDSET: NEX & BYD Technical Analysis - Key Resistance Levels Ahead
NEX POINT PCL (NEX) - BULLISH REVERSAL**
- **Current Price:** 0.98 THB
- **Target 1:** 1.02 THB (+4.1%)
- **Target 2:** 1.05-1.07 THB (+7.1% - +9.2%)
- **Stop Loss:** 0.85 THB (-13.3%)
- **Risk/Reward:** 1:2.5
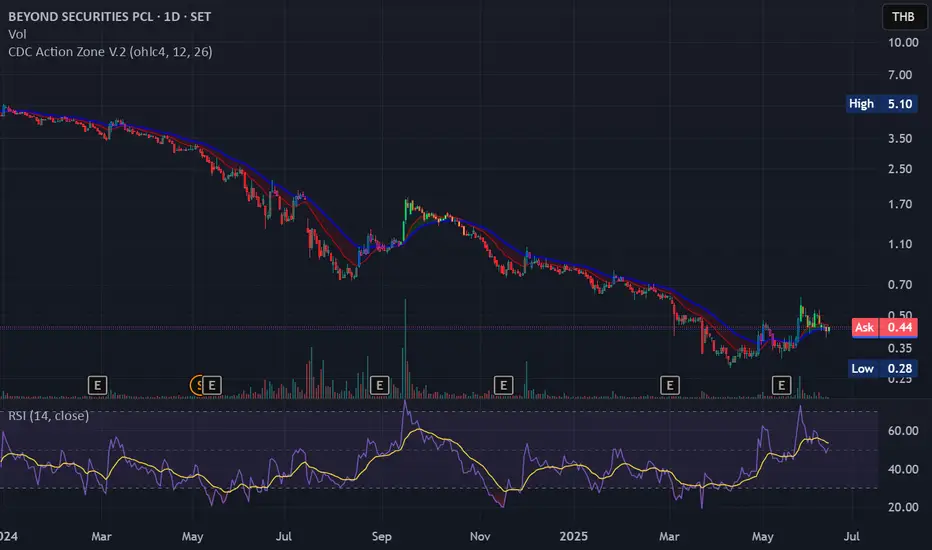
BEYOND SECURITIES PCL (BYD) - ACCUMULATION PHASE**
- **Current Price:** 0.36 THB
- **Target 1:** 0.45 THB (+25%)
- **Target 2:** 0.52-0.54 THB (+44% - +50%)
- **Stop Loss:** 0.34 THB (-5.6%)
- **Risk/Reward:** 1:4.5
Technical Analysis**
NEX Analysis:**
Bullish Signals:**
- Price recovering from 0.85 support level
- RSI at 78.12 showing strong momentum (though overbought)
- Volume confirmation at 1.56M
- Breaking above key moving averages
Risk Factors:**
- RSI in overbought territory - potential short-term pullback
- Need to break 0.98-1.00 resistance convincingly
Key Levels:**
- **Immediate Resistance:** 0.92, 0.98-1.00
- **Major Resistance:** 1.02, 1.05-1.07
- **Support:** 0.85, 0.90
BYD Analysis:**
Bullish Signals:**
- Bouncing from critical support at 0.35
- RSI at 42.68 - plenty of room for upside
- Consolidation pattern forming - accumulation phase
- Low volume suggests institutional accumulation
Growth Potential:**
- Multiple resistance levels provide staged profit-taking opportunities
- Strong risk/reward ratio due to tight stop loss
**Key Levels:**
- **Immediate Resistance:** 0.43-0.45
- **Secondary Resistance:** 0.48-0.50
- **Major Resistance:** 0.52-0.54, 0.58-0.61
- **Critical Support:** 0.34-0.36
Time Horizon: July - August 2025
Expected Scenarios:
Bull Case (70% probability):**
- NEX reaches 1.05+ as tech sector recovery continues
- BYD breaks 0.45 and moves toward 0.52 on improved sentiment
- SET Index supportive environment
Base Case (20% probability):**
- Sideways consolidation within current ranges
- NEX: 0.90-1.02 range
- BYD: 0.36-0.45 range
Bear Case (10% probability):**
- Market correction affects small caps
- NEX retests 0.85 support
- BYD falls below 0.34
Trading Strategy
For NEX:
1. **Entry:** Current levels (0.98) or on pullback to 0.94-0.95
2. **Position Size:** 2-3% of portfolio
3. **Take Profit:** 50% at 1.02, 50% at 1.05+
4. **Stop Loss:** Strict at 0.85
For BYD:
1. **Entry:** Accumulate between 0.36-0.38
2. **Position Size:** 3-4% of portfolio (higher conviction)
3. **Take Profit:** 30% at 0.45, 40% at 0.50, 30% at 0.54+
4. **Stop Loss:** 0.34
Catalysts to Watch
Positive Catalysts:
- Q2 2025 earnings season results
- SET Index breaking key resistance
- Sector rotation into small caps
- Economic recovery momentum
Risk Factors:
- Global market volatility
- Thai economic data disappointments
- Profit-taking in overbought conditions
- Liquidity concerns in small caps
SCC BuySCC Buy 165 cut 160 TP 2-3 R
SCC Going up and pull back , it's time to buy,
Remember dont over risk, just risk 1-2% per trade

BDMS BDMS: Perfect Entry Point? 🏥📈
Looking at BDMS (Bangkok Dusit Medical Services) - this setup is screaming opportunity! 🔍
The chart is telling us a clear story:
Price just bounced off the long-term uptrend channel support (green line) 💪
Currently trading at 23.5 THB with a perfect rejection at the 23.1 THB support level
RSI at 44.63 shows momentum picking up from oversold conditions 🚀
That yellow arrow pointing up? That's the projected move everyone's watching!
What I'm seeing here is a classic "buy the dip" scenario in a quality healthcare stock. BDMS has formed a solid base at current levels after the recent pullback, and now looks ready to resume its uptrend toward 30-32 THB region 📈
Smart money strategy:
Entry: Current levels around 23.5-23.8 THB look optimal
Target: 30-32 THB (previous resistance zone) = 25-35% potential upside! 💰
Stop loss: Below 22.5 THB to manage risk
Healthcare sector has always been defensive with reliable growth, and BDMS is the premium player in Thailand. This isn't just a technical trade - it's backed by fundamentals too! 👨⚕️
Time to load up before the next leg higher begins! 🔥 #InvestingForFuture
Disclaimer: Just sharing my chart analysis - do your own DD before pulling the trigger 😉

Gulf GULF: Time to Invest? 📈
GULF is looking super interesting right now! See how the price beautifully bounced off that 43 THB support level? 🚀
My analysis:
Price moving in a long-term upward channel (green lines) since 2018 💪
RSI at 44.92, nowhere near overbought - plenty of room to run
Notice that yellow arrow pointing up? That's what traders are waiting for 👀
I'm targeting 60-64 THB (check previous peaks) with potential 30-40% gain 🤑 But keep a stop-loss below 43 THB to stay safe!
Honestly, energy sector still looks strong, and GULF has solid fundamentals with powerful business owners. This looks like a good long-term hold, not just a short trade 👍
Bottom line: Buy now at 45.xx THB and ride it up to the 60 THB zone! 🔥 #GetRichOrDieTrying
Remember this is just my idea - do your own research before investing (not financial advice) 😉


RPC falling wedge pattern? RPC has historically exhibited occasional large bullish candlesticks indicative of sudden upward momentum. Currently, the stock is significantly oversold, trading at its lowest price on record. It has now retraced to the 1.272 Fibonacci level, suggesting a potential setup for a rebound or a technical bounce.

PR9 < PRARAM 9 HOSPITAL >The price has retraced to the trendline and the 50% Fibonacci level, while the financial statements have shown positive results.
TP1 > 26.5 > RR > 1:2.9
TP2 > 34.0 > RR > 1:6.7

SCB and Bank Trend and Thailand Economy TrendSCB and Bank Trend and Thailand Economy Trend, This is not investment advice this is just for case study

Singapore International School of Bangkok ( Short )Cooling off. Overshot to the upside. Needs time to grow into earnings.

ASK hitting 1.618 fibonacci extensionOn a longer-term chart, the price has hit the Fibonacci extension level in a downtrend of 7.05 THB. Currently, this level seems to support the price. Putting the fundamentals aside, this could be a good entry point for technical play.
The fisher transform on the weekly chart has also crossed up.
Entry: ~7.35 THB
TP: 17 THB
SL: 6.40 THB

AURA broke out of trendline and Bollinger band for a breakoutAURA had broken out of the Bollinger Band and the Trendline resistance which is a good candidate for a breakout trade

Buy AOT When Price Back To Demand ZoneAOT Down Trend.
For Now Wait And See.
Buy When Price Back to Demand Zone.
Buy AOT Price 40.25-38.00 Bath.
If Price Close Under 38.00 cut loss.

Is SIS going up? How far?SIS is currently around a major support level, shown as the yellow dashed line. In my opinion, it is still likely to bounce off this level and test the next resistance.
This is supported by a strong and robust volume profile, which, for me, is a sign of potential upward movement.
However, SET sentiment and the Thai economy remain weak, and the major trend for SIS is still downward. Therefore, I don’t expect SIS to go too far.

SIS is Going Up as Predicted—But How Far?
Today, SIS formed a green candle with a short upper wig. The Point of Control (POC) has moved higher, but with negative delta value (-126.5K), -> suggesting that sellers are still active despite the upward movement.
IMO, the uptrend is still in its way, but the question is how far will it go?

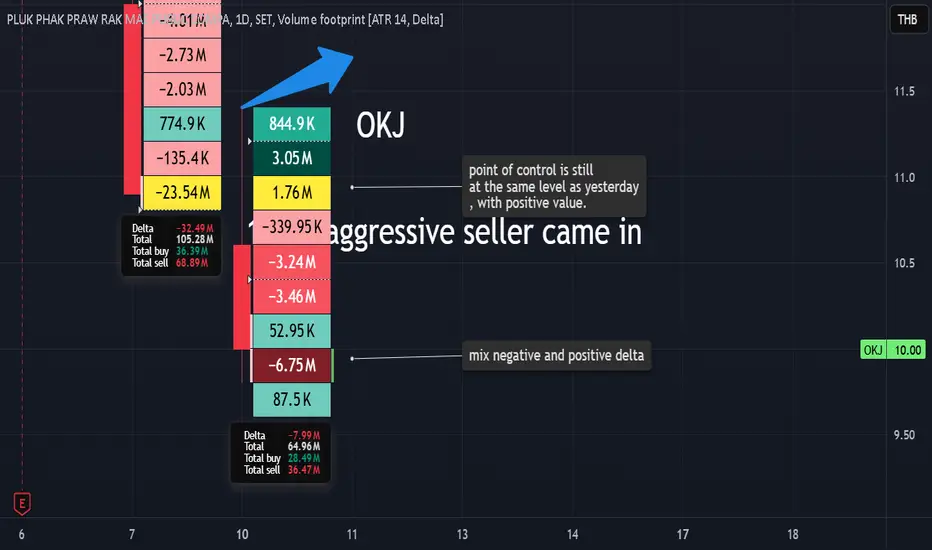
Second Day of Strong Selling in OKJ, but Signs of Optimism !!!
Today is the second day of strong selling in OKJ, but there are several promising signs:
- The Point of Control (POC) remains at the same level as yesterday and shows a positive delta (more buying than selling).
- Despite the red candle, the lower spreads contain a mix of positive and negative deltas, indicating buyers come in.
- The price should have stayed around 10.7, but at 16:30, a big, and aggressive seller entered, dragging the price down to 10.0. but many buyers were waiting to absorb the selling pressure along the way.
I remain optimistic about OKJ. !!!
STA has a change to going up again, after a long way down.Support: 14.6
Stop loss: 14.4
if on Monday 10th Feb , opening price is equal or greater than 14.4, it will be a great chance that STA will going up, at least to test the EMA25.
Momentum and volume profile on Fri, 7 are very promising, with buyer comes to the place.

WICE is going up to test EMA25 for a new round.Support 3.28 , stop loss 3.20
from this day graph, rsi and momentum have shown divergent trend since new year, with the latest long lower wig with almost all are negative delta values with ask imbalance on the side.
IMO, 3 positive deltas make it not that bull, but overall chance will be going up anyway.

TLI wait for upward break out.TLI wait for upward break out. Fundamental Ok.
Now pennant wait for upward break out strong buy.

Corrective Wave and Chart Pattern Analysis - RSI TFW DivergenceCorrective Wave Structure a ABC Analysis pattern in TFW timeframe
Observations:
A bullish divergence is evident in the momentum near the support zone indicating weakening bearish momentum, the end of wave C, and a potential reversal to the upside.
Analysis:
- Wave A: completed descending channel retraced 61.8% of previous uptrend with 5 wave diagonal pattern - wave A.1 the shortest and wave A.3 is the longest.
- Wave B: retraced 61.8% of Wave A with an extended flat 3 wave abc pattern - wave B.c extended 261.8% of B.a
- Wave C: A descending triangle /ending diagonal pattern is visible within Wave C current extending 61.8% of Wave A.
Support:
- The Green zone (liquidity support) around 4.50 THB is significant, acted as a strong support level multiple times in the past.
- A breakdown below this zone could lead to further downside (red arrow scenario) while holding above it might trigger a reversal (green arrow scenario).
Breakout:
- Resistance levels marked by Wave B’s high 6.4+ THB and intermediate levels around 4.9+ THB are critical breakout moving average 20 week dynamic resistance zone.
- An upward breakout past these levels would confirm the end of the corrective phase and the start of a new bullish impulse wave.
Potential Scenarios:
Bullish Case (Green Arrows):
TP1: Price holds the liquidity support zone and breaks above 5.50 THB (near-term resistance).
TP2: A successful retest of 6.50 THB Wave B zone could lead to a new bullish wave formation.
RRR: 3:1
Bearish Case (Red Arrow):
A break below the liquidity support zone 4.50 THB would confirm continued bearish pressure.
Price could target lower levels, possibly extending toward 3.50 THB or beyond.
Action:
+ Look for bullish confirmation with a breakout above descending triangle (ending diagonal) resistance 4.80 THB zone
+ Watch for volume surge volume profile indicator to validate the reversal trigger.
+ Monitor price action near the liquidity support zone 4.50 THB.
+ Accumulate only if the support holds and momentum confirms a bullish reversal.
Always trade with affordable risk, respect your stop.

SCB BUY Buy SCB
Price Stand Over Supply Zone Month.
Buy Price 118 THB
If price Close Under 118 THB Cut loss.

Price is About to Breakout the Major High with EMA Signal SupporBoth EMA12 and EMA26 in the weekly and monthly timeframes are showing bullish signals. Prices have been consolidating for 1078 days, indicating a potential breakout. Since September last year, volumes have decreased, suggesting a buildup of pressure. Currently, the price is breaking through a Low Volume Node (LVN) area to the left, which could lead to a significant move upwards.

Buy KTBBuy KTB
Price Stand Over Months Resistance
Buy 21.60 if price stand with A day candlestick confirm (Day)
Or 20.90 - 20.80 (Sub Demand Zone)
Or Buy Next Demand Zone Buy 20.40 - 20
Price Below 19.80 Sell
