KAMART and Triangle PatternKAMART has been consolidating in triangle pattern for several weeks. Normally, when the stock breaks out the pattern, 75-125% of the height of triangle is expected to be a simple target. However, calculating your own risks is still recommended. Good Luck!


AGEFormation cup with handle?
Probability
1) Hit and can break the first target.
2) Hit and false break and throwback.


DELTA | Wave Analysis | Target Projection - Take Profit ZonePrice action and chart pattern trading setup - take profit position
> A descending triangle major wave 2 - ABCDE pattern with 3-3-3-3-3 complex structure
> Target: a possible scenario of making D-wave with an upcoming ending diagonal at the upper resistance of the triangle 0.786-1.0 retracement +15-20% upside
> Stoploss: at the previous high position a-wave - 8% downside
> Risk reward ratio: 2:1 approx.
> After completing the D-wave could possibly retrace downward trend 0.382 - 0.786 for the final E-wave which is the most difficult wave to predict.
Always trade with affordable risk and respect your stoploss
Good luck


BA follow to targetSET:BA
Target : 11.4 / 11.8
Cut loss : 10.7 / under yellow line
good case :
go down but over 10.7 (blue arrow)
bad case :
go down to yellow line and break (green arrow)

TPIPL waiting to break in weekSET:TPIPL
resistance line : 1.75 / 1.86
support line : 1.65 / support line

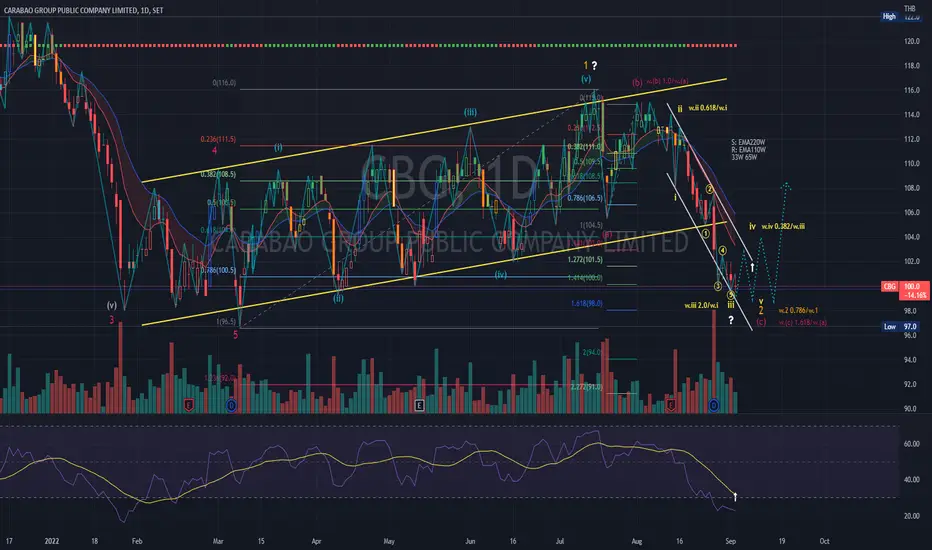
CBG | Wave Analysis | Leading Diagonal 2-Wave Price action and chart pattern trading setup
> A possible 2-wave leading diagonal pattern ending at 0.786 retracement zone
> Entry @ downtrend breakout with reversal pattern - watch for double bottom / inverse head & shoulders / triangle wave candlestick consolidation
> Target @ 0.786-1.0 retracement to previous 1-wave + 10 - 12%
> Stoploss @ the lowest position -4-5%
> Risk reward ratio: 2.5:1
Always trade with affordable risk and respect your stoploss
TCC | Wave Analysis | Falling Wedge Breakout TargetElliott Wave Projection - Price action and chart pattern trading
> Bullish Wedge Elliott Wave downtrend channel breakout
> Key resistance SMA200
> TP1 @ 0.382 retracement of previous wave 5 - volume profile point of control zone equal to distance of wave E to the falling wedge breakout point
> TP2 @ 0.5 retracement - upper resistance of key volume profile zone = distance of wave C > D from breakout point
> TP3 @ 0.618 retracement - equal to the distance of A>B +30%
> Entry @ Pullback SMA200 zone
> Stoploss @ SMA20 zone -10%+
> Risk reward ratio: 3:1
Always trade with affordable risk and respect your stoploss

LANNA | Wave Analysis | ABCDE Triangle Breakout TargetPrice action and chart pattern trading
> Elliott Wave Projection - Rising triangle wave ABCDE breakout pattern
> TP1 @ Upper channel resistance wave v leading diagonal - 1.382 extension of wave iii +12% upside
> TP2 @ 1.618 extension of wave D +18% upside
> Stoploss @ SMA20 - 6-7%
> Risk reward ratio: 2.5-3:1
Always trade with affordable risk and respect your stoploss

MK RESTAURANT GROUP - short positionThe RSI indicator is above 70 which shows overbought conditions.
We expect that the price will get rejected at the resistance level . Next we expect the price to retest the downsloping trendline as a support.
Entry, stop loss and target are shown in the chart.

HANA | Elliott Wave Projection | Inverse Head&ShouldersPrice action and chart pattern trading setup
> Elliott wave projection downtrend breakout with inverse head & shoulders pattern
> A possible wave B rebound targeting 0.382 - 0.5 retracement of A
> Entry @ H&S breakout SMA25W
> Target @ 0.382 retracement of Wave A / SMA50W zone +25%
> Stoploss @ right shoulder / SMA400W -12%
> Risk reward ratio: 2:1
Indicator:
> RSI Week bullish divergence, breakout MA line
> MACD Week golden cross below baseline
Always trade with affordable risk and respect your stoploss


set_ict_ALTbuy
cut : 2.42
tp1 : 3.72_70
tp2 : high_30
then wait to buy on dip
#I bought it at 2.76, but I just came to make plans.
not investment advice.

mai_tech_COMANbuy
cut : 2.38
tp1 : 5.24_35
tp2 : 5.50_40
tp3 : 5.68_20
else_5 > wait and see
then wait to buy on dip again
not investment advice.

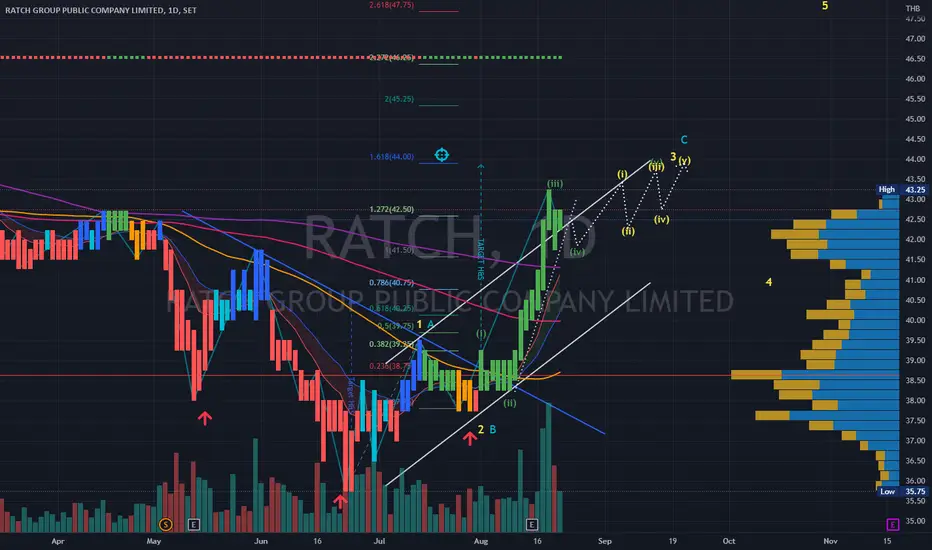
RATCH | Elliott Wave Analysis -Uptrend rising wedge projectionPrice action and chart pattern trading - take profit position
> Rising/Bearish Wedge false breakout wave iv correction
> Target Inverted Head & Shoulders 1.618 extension of wave 1 or A
> Recommend take some profit along upcoming wave (iii) of wave v of wave 3 or C should be the longest wave.
> Indicator: RSI / MACD should start showing bearish divergence during the next cycles
M prepare to breakSET:M
M price come with volume if break through on 56.00 (old high)
resistance line : on EMA 200 / 57.50 (if come with volume) / green line
support line : on yellow line
cut loss : under yellow line

BGRIM | Elliott Wave Analysis - Leading Diagonal Cup HandlePrice action and chart pattern trading
> Cup & Handle pattern with a leading diagonal wave forming the cup handle, possibly iv-wave correction targeting EMA70 slightly below the lower channel support
> Expecting a candlestick tight formation for reversal pattern formation before entering a long entry.
> The target 3-wave confirmation should break out the upper channel resistance.
> The final target of cup & handle at 2.618 extension zone


OR sideway up to breakSET:OR
support line to entry : 25.25 /25.50
short Target Line : 27.50
then break look new target at 30.25

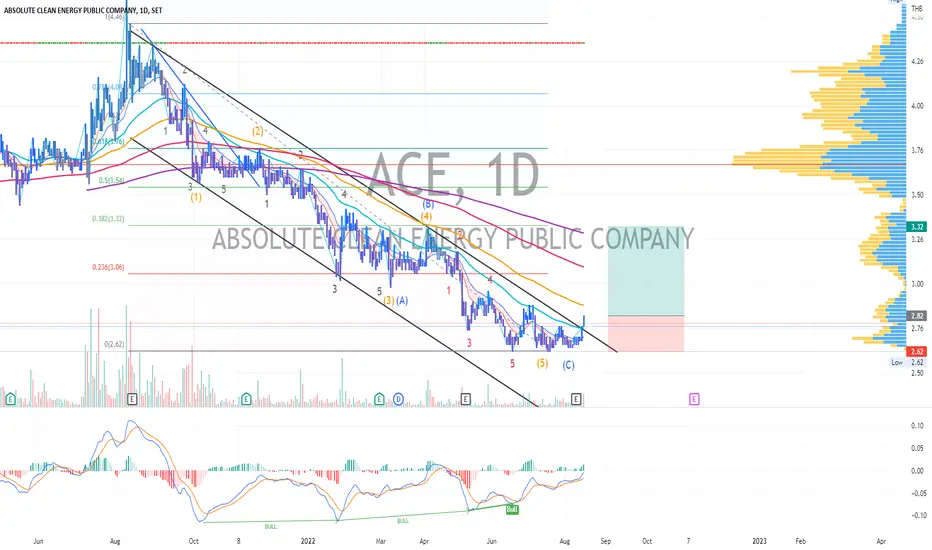
ACE | Elliott Wave Analysis | Triple Bullish DivergencePrice action and chart pattern trading
> Elliott Wave downtrend channel with triple bottom breakout
> Indicator: MACD triple bullish divergence
> Entry @ breakout & pullback support EMA50 zone
> Medium Target @ EMA200 - SMA200 zone 0.382 Fibonacci retracement +17%
> Stoploss @ triple bottom position - 7%
> Risk reward ratio: 2.5:1