Berli Jucker Cellox LTD. (BJC, SET) Seem to end wave BBerli Jucker Cellox LTD. (BJC, SET) Seem to end wave B, If the price don't below green "c" and break the green "d" and "b"
After price Break Resistance, Confirm the end of the triangle, Ready to the next wave :D :D: D
The next big wave target can reach around 110THB - 113THB if it confirms the pattern.
SET:BJC
Anyway, I'm still new to trading (Just 1 year), Feel free to comment and share any ideas.

Berli Jucker Cellox LTD (BJC, SET) still in wave CBJC is still in a downtrend, look and head to old resistance.
SET:BJC


BBGI | Wave Projection | Upcoming Inverse Head & ShouldersPrice action and chart pattern trading setup:
> Possible upcoming ending diagonal of intermediate 5-wave downtrend with inverse head & shoulders
> Entry @ breakout neckline
> Target @ approximately the height of the head 9 baht
> Stoploss @ upcoming right shoulder minor 5-wave
> Risk reward ratio: 2:1 with downside -6%
Indicator:
> RSI +50 cross MA and MACD bullish divergence
Always trade with affordable risk and respect your stoploss

WHA | Wave Projection | Inverted H&S Bull DivergencePrice action and chart pattern trading setup:
> Wave projection possible intermediate 4-wave rebound with inverted head & shoulders reversal pattern and MACD bullish divergence
> Entry @ Neckline pullback
> Target @ H&S Target or 0.386 retracement of previous 3-wave +6% upside
> Stop @ right shoulder - 3% downside
> RRR: 2:1
The downtrend target C-wave or final 5-wave estimated at 0.786 of the last B-wave
Always trade with affordable risk and respect your stop

CPF Elliott Wave Projection | Triangle Breakout - RetestPrice action and chart pattern trading
> Wave Analysis projection - descending triangle / wedge breakout trading target
> Entry @ support retest breakout downtrend wave triangle
> Target 1.0 - 1.618 extension of ABC uptrend wave possible at volume profile resistance
> Stop @ right shoulder of inverted head & shoulders
> RRR 3:1
Always trade with affordable risk and respect your stoploss

CRC | Wave ABCDE Projection | Ascending Triangle Trading Target Price action and chart pattern long term trading setup - catching the impulse 3rd wave extension.
> ABCDE Wave ascending triangle correction during 2nd wave is one of the most powerful that generates maximum profit for traders
> Possible making the final E wave before breakout
> Watch out for dump & pump on the way as prolongation of the E wave.
Target estimated at the length of A wave equals to 1.618 extension or could be an impulse 3 wave - upside +40% at breakout position
Stoploss @ the lowest position of E wave - 10 - 15 % downside
RRR : 4:1 for long term trade

Regional Container Lines: Price Action and Areas of Interest It looks to me as if RCL is a corrective move to the downside.
RCL is interesting as price action brings the actively traded value of the stock down to 37 Baht, some 30 Baht away from it's all-time high. Despite convincingly bearish PA since August of 21' RCL has posted great profits, with higher revenue and somehow, a higher profit margin every quarter.
Their assets have grown significantly without trapping themselves in debt, while their cash and cash equivalents have grown almost 500% since 2015. The company could pay off all their 5.7 Billion of debt with just their cash. This is great, considering the tumultuous times we are in! They also have the cash to acquire more PPE (Which they have done).
In the short-term I think there is potential to find support at this level and potential for volume to move price to the upside.
4HR View: I'm using the 4HR view because the E of an ABCDE does not need to touch the upper trendline and I'm not entirely sure how high we go before the E is completed. It is also possible that we can have a "throw-over" of the upper trendline, in that case we can expect price to move lower than illustrated here.
As said in the beginning of this post, I think it is probable that we have PA moving to the downside. As an interested buyer I have outlined potential levels of interest. They're outline in the chart. This is my perspective from the 3D Chart.

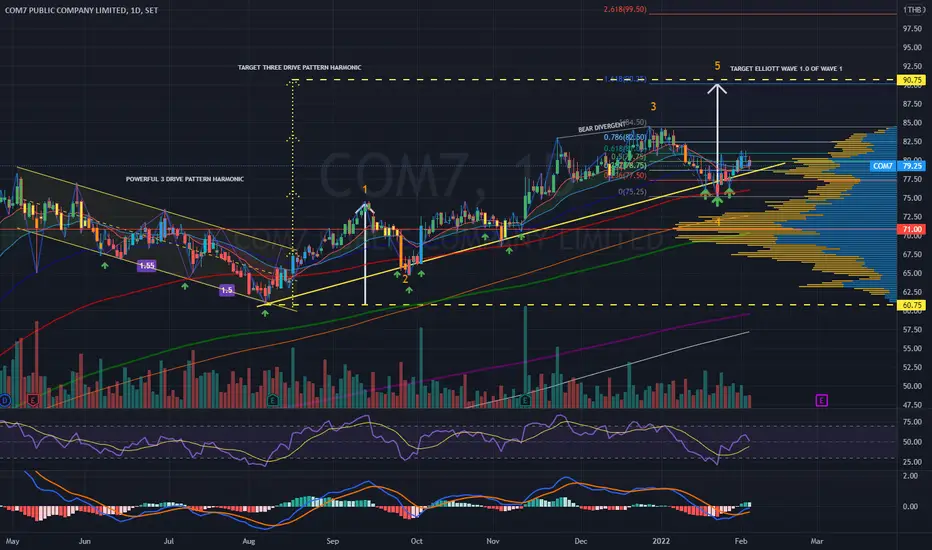
COM7| Target Elliott Wave 5th vs Powerful Three Drive HarmonicPrice Action & Chart Pattern Trading
> Estimated Target MINOR ELLIOTT WAVE 5TH based on Fibonacci 1.0 of wave 1 and 1.618 retracement of wave 4 vs the earlier powerful THREE DRIVE HARMONIC PATTERN of MAIN ELLIOTT WAVE 4TH correction
> Reversal pattern INVERTED HEAD & SHOULDERS in day timeframe.
Trade with affordable risk 3:1
Always respect your stoploss
Good Luck
AOT and WTZ1+Buy on DipAOT has been consolidating in the trading range for several months due to effects of Covid pandemic to the airport operation. However, after the situation becomes better, some investors expect company's revenues will return. Expectation reflects to its technical signal on WTZ1. After its price broke out the range, I wait for it pull back until buy on dip signal appears. Managing your risks is still strongly recommended. Good Luck!

SET:KEX - Potential Long. B/O of heavy consolidation zonePrevious bottom bounce failed so here's another attempt for potential long opportunity. Target - 37-40 THB (previous support/VWAP from IPO)
Key Observations:
- Break out of previous high created in March 2022
- Break out of volume shelf at the bottom (668M shares traded vs 442M shares float)

ADVANC | Wave Projection | Possible trend reversal Inverted H&SPrice action and chart pattern trading setup
> Elliott Wave Projection - possible end of correction ABC
> Upcoming trend reversal pattern - inverted head & shoulders
> Entry @ Neck line breakout
> 1st Target TP1 - SMA200 and TP2 - previous Wave (B) position
> Stoploss @ head position
> RRR: 2:1
> Indicator: MACD bullish divergence
Always trade with affordable risk and respect your stoploss

BR | Parallel Channel Breakout | Entry@Pullback PositionBR | Thailand SET Index | Food Sector | Chart Pattern Trading
Chart Pattern: Parallel Channel
Price Action: Strong Momentum Breakout - Entry @ Pullback
Indicator:
> MFI | Fund Flow Surge bullish signal
> RSI | Bullish signal above MA line - still not overbought
> MACD | golden cross signal line and above baseline 0.
Trade with AFFORABLE risk
Trust in SYSTEM
Always respect STOP-LOSS
Good Luck
DP

TIDLOR : SET INDEX It's felt like ages since i last log in trading view...
that i lost the button to open chart, n what's chart+ anyways ?
.
I will try to log in here more often :))

RATCH| Elliott Wave Projection | Inverted H&S Reversal Pattern Price action and chart pattern trading setup
> Elliott Wave projection - downtrend final correction position with an expanding diagonal pattern.
> Inverted head & shoulders reversal pattern in TFD with bullish engulfing candlestick
> Indicator: RSI strong bullish signal cross above MA and MACD golden cross signal line
> Entry @ Neckline breakout
> Stoploss @ right shoulder position
> Target @ previous wave 4 and 2
> RRR: 2:1 with -5% downside risk

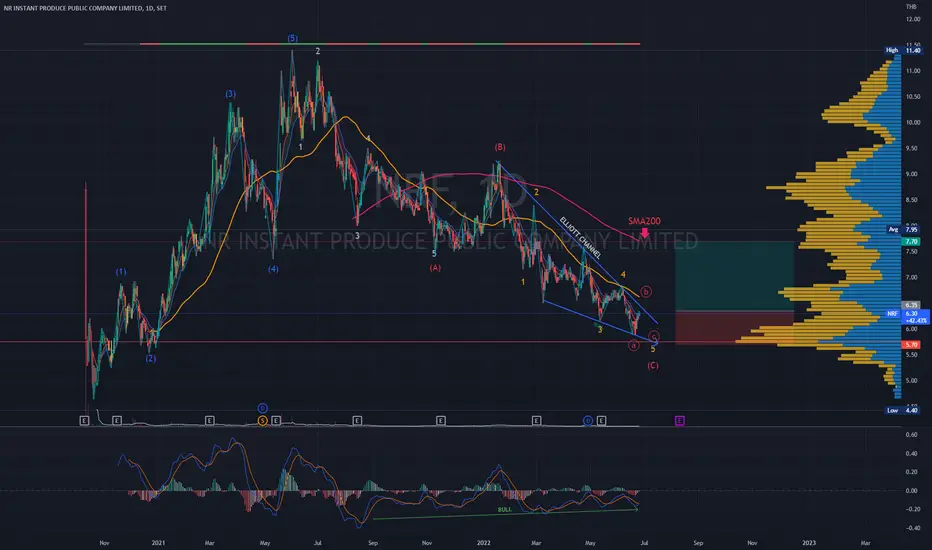
NRF| Wave Projection | Ending Diagonal | Target DowntrendPrice action and chart pattern trading setup
> Downtrend target in range with an ending diagonal pattern of wave C correction
> Entry @ Elliott Wave channel breakout
> Target @ SMA200 for medium term trade
> Stoploss @ Target Wave 5 with downside -10%
> RRR: 2:1
Indicator:
> MACD bullish divergence continuously
Always trade with affordable risk and respect your stoploss
BCP | Double Bottom Uptrend Breakout | Marubozu White BullishBCP | Thailand SET Index | Energy Sector | Chart Pattern Trading
> Double Bottom Uptrend Breakout within a major parallel channel
> Price Action > Marubozu White candlestick - a strong bullish confirmation
>RSI | Bullish signal crossed up MA line above 50
>MACD | Golden cross signal line just below 0 in uptrend
Developing chart pattern in simple Harmonic ABCD rising
Trade with affordable risk 3:1
Always respect your stop-loss
Good Luck
DP


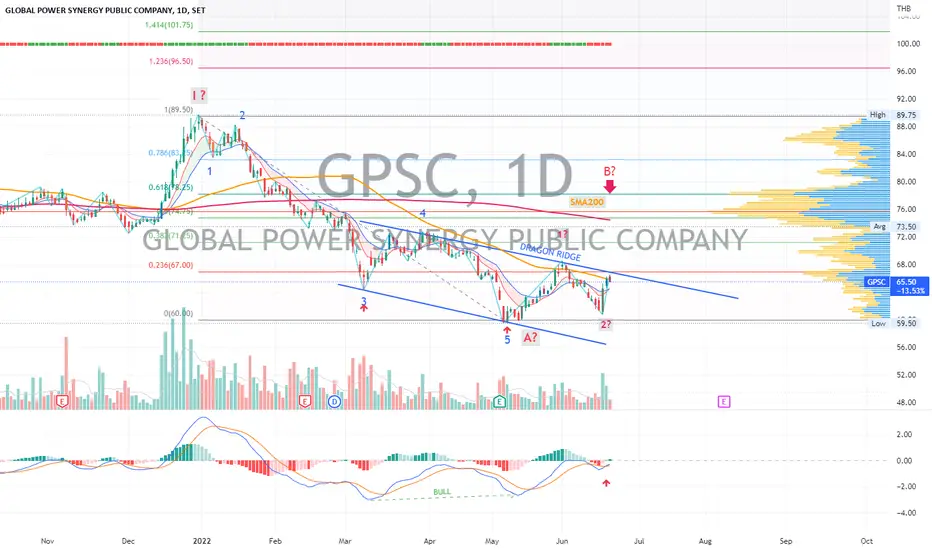
GPSC | Wave Projection | Bullish Dragon Flag SetupPrice action and chart pattern trading setup
> Bullish Dragon pattern in correction wave A, possible reversal for uptrend wave B
> Entry @breakout channel dragon ridge
> Target @ 0.618 retracement of previous top SMA200 zone
> Stoploss at the low A position - RRR: 2:1 downside -7%
Indicator:
> MACD bullish divergence signal crossing up baseline 0.
AVC Just rebound, It has the sideway channel and already test previous heigh. 2 way for this. First, retest heigh and breakout. Second fall down to support line. 40/60

BBGI | Wave Projection Dragon Pattern - Bullish divergencePrice action and chart pattern trading setup
> An impulse downtrend Elliott Wave channel with a dragon pattern forming rear legs
> possible upcoming bullish divergence signal at the next support 8.00 baht targeting 2.618 extension
> Entry @ dragon ridge breakout
> Short term target @ previous wave 4 position
> Medium term target @ wave 1 and wave 2 position + 15 - 20% upside
> RRR: 2:1 for short term and 3:1 for medium term trade
Always trade with affordable risk and respect your stoploss
