BANPU | Elliott Wave Projection | Minor Wave 5 TargetPrice action and chart pattern trading
> The big question mark is Wave C correction is relatively too short in nature of a standard zigzag correction.
> Assuming the correction is done, the current minor leading diagonal target Wave 5 is projected at 1.236 - 1.618 retracement of the current minor wave 4.
Always trade with affordable risk and respect your stoploss

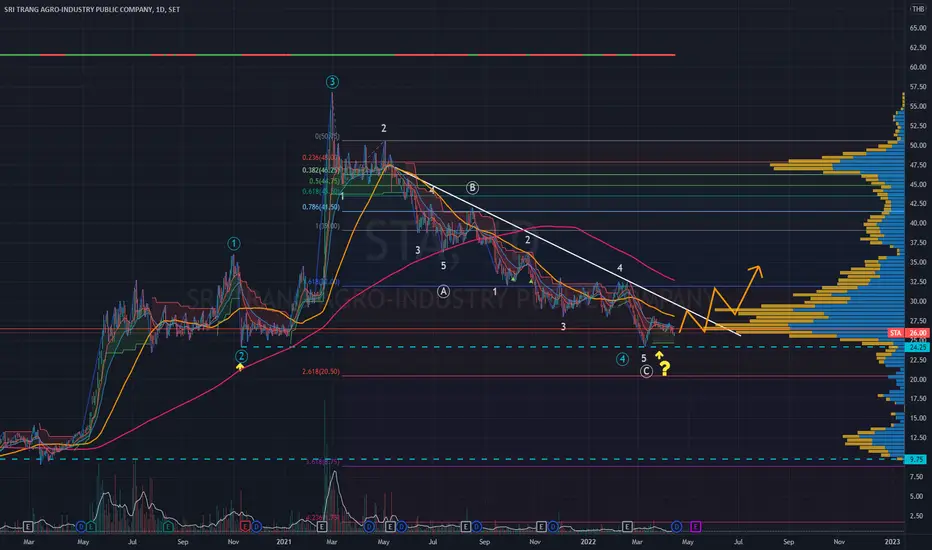
STA | Elliott Wave Projection | ZZ Correction ABCPrice action and chart pattern trading setup
> Leading Diagonal Family now the zigzag primary wave 4 can not go lower than wave 2 (slight overlapped maybe possible practically.)
> If wave 4 is a failure, the current wave would be reset to wave 2 and projected wave 3 would become wave 1.
> Wave 4 is always zigzag family - sideway breakout is optional as a combination with flat
> Wait for confirmed new wave breakout before entry at wave 2 or wave 4 minor
> 1st target for long can be set at 0.5 to 0.786 retracement top of wave 3
> The Final target at wave 5 always ends beyond wave 3 at 1.236 or 1.618 wave 4 retracements.
> Recommended risk reward ratio at 3:1 for medium and long term trade.
Always trade with affordable risk and respect your stoploss.
TRT Long Fundamentals and Electricity DemandCurrently P/BV sits at 0.68 which is lowest in it's sector. Transformers are expected to make a comeback in the next few quarters as the effects of the pandemic dies down. Hold as strong balance sheet is expected with reduced long term debts, backlogs and lower variable costs. Another good possibility is the weakening of THB that will positively affect profits due to expected improvement of exports.

TCAP: Long Upside about 20% Looking great technically, holding at 34.75 expected target price at about 42 according to Fibo.

AOT Week 11/04/2022 Price 66.50 [Collect the power to Fly]AOT Week 11/04/2022 Price 66.50
1. The price is still rising above the EMA 20/50/100/200.
2. The price has raised the base continually.
3. The price cannot pass through the area of 70 baht.
4. There is a cumulative amount of purchases greater than sales.
strategy
1. Watch the price of 70 baht. If the price passes, continue with 73.75/83.25.
2. Zone, accumulated buy 66/62.25/60.75/58.50 and may take profit in the 70 area first.

Advanc 11/04/2022 price 227 🔨🔨🔨Advanc 11/04/2022 price 227
1. The big picture is still in an uptrend.
2. The price has come up to test the key resistance of 242 baht. Failed to pass, has made a decrease.
3. The price has moved down to the first support 223 (Fibonacci Cluster+EMA20).
4. If the price cannot stand above 223, it will go down to the next support level 212/194.
5.volume last week, very strong sales

DELTA | bullish flag continued | breakaway candlestick breakout Price action and chart pattern trading setup
> Bullish Flag sideway down continued - speculative trading entry setup
> Breakaway candlestick breakout on day timeframe setup
> 1st entry at pullback breakaway candlestick
> 2nd entry at pullback gap
> target at SMA400 or slightly above SMA50 at near volume profile point of control
> stoploss at the lowest banker chip entry
> risk ratio: 2:1 for short-medium term trade 2 -3 weeks
Indicator:
> strong volume support - smart money
> banker chip volume entry at the lowest
> banker fundflow reversal coming out of oversold area
> BBD signal positive golden cross above baseline
> KDJ sto - rebounded showing bottom signal
Always trade with affordable risk and respect your stoploss

TTA | Parallel Channel Doubled Bottom Titanic PatternPrice action and chart pattern trading setup
Parallel channel support and resistance - possible doubled bottom - new technical indicator - Titanic Pattern
Smart money and banker chip volume support at doubled bottom positions - technical rebound expected.
> Entry at support parallel channel near bottoms
> Target at the upper parallel channel
> Stop loss at bottom plus average daily range (ADR)
> Risk Reward ratio: 1.5:1 for short term trade.
Always trade with affordable risk and respect your stop loss

CRC and WTZ1+WTZ2 in multi setupCRC and WTZ1+WTZ2 in multi setup. I have the same ideas as illustrated on CPN charts (the previous one). Limit your risks before trading. Good Luck!

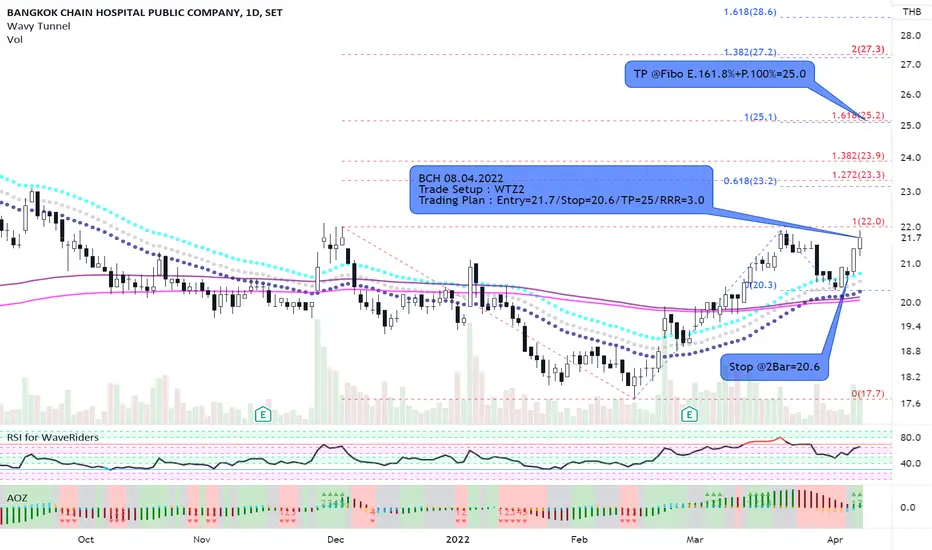
BCH and WTZ2If seeing the financial statement of BCH in the previous year, you may find distinctly high earnings comparing with later annual profits. The performance reflects to its chart pattern and technical signals. When a trade setup is formed, I applied WTZ2 for trading plan with Fibonacci targets. Just try and enjoy with well money management.
CPN and WTZ1CPN has been consolidating in the trading range for many months. This is the first date of this stock to penetrate the upper range after the sideway period. I apply WTZ1 for the trade setup and RRR calculation. Good Luck

RCL | Contracting Triangle Wave Correction ABCDEPrice action and chart pattern trading setup
> Contracting triangle wave correction ABCDE ending estimated at just above SMA400
> Long trading at lower triangle support and / or A position
> 1st Target at 0.5 fibonacci retracement at upper triangle resistance.
> Risk reward ratio at 2:1 for medium term trade.
> Stop loss at SMA400
Indicator:
> Smart money and banker chip volume support at A and C positions.
> Fund flow RSI still in the oversold zone, wait for the rebound.
> BBD signal crossing up the baseline
> KDJ stochastic in downtrend ribbon, wait for the upswing for entry.
Always trade with affordable risk and respect your stoploss

KAMART and WTZ2 in multi TF.KAMART and WTZ2 in multi TF, both TF day and Wk. Actually, I counted EW. roughly but have no time enough to label them on the chart. However, the setup and this pattern are interesting to make the trading plan as illustrated on the chart. Enjoy.

KISS | Local Trend Breakout Trading Price action and chart pattern trading
> Local downtrend channel breakout trading
> Resistance SMA50, Global downtrend line, SMA200
> Stop loss at the lowest point
> Recommended risk ratio 2:1 for medium term trade
Indicator:
> Smart Money and Banker Chip strong volume support at Index 40X
> Fundflow strong bullish rebounded out of oversold zone
> BBD bullish divergence signal cross above baseline
> KDJ stochastic uptrend signal.
Always trade with affordable risk and respect your stoploss

OR : SET INDEX (Updated) Look interesting to collect at support (See price action first)
this stock great fundamental and future
Everything is on the chart
.
To play safe then can buy after the break out

CMO _Rebound_4Apr2022_Cutloss 8.50CMO _Rebound_4Apr2022_Cutloss 8.50
Morning Star CandleStick Pattern

CGH-W4| Bullish Flag Breakout Trading SetupPrice action and chart pattern trading setup
> Bullish Flag breakout - entry at pullback support closest to the breakout point - just above SMA20 avoid chasing price
> 1st target at 0.5 retracement zone and 2nd target at 0.786 Fibonacci retracement of 3rd wave position.
> Stop zone at the low point of breakout candlestick
> Risk reward ratio at 2:1 for medium term and 3:1 for long term trade
indicator:
> strong smart money and banker chip volume support at wave 4 position
> Fundflow RSI rebounded from oversold bottom area
> BBD banker bullish signal above baseline
> KDJ stochastic uptrend candle reversal pattern.
Always trade with affordable risk and respect your stoploss.


INOX : SET INDEX (Requested) Support and resistance
For weekly momentum initially heading down to 1.30 if doesn't hold then 1.10

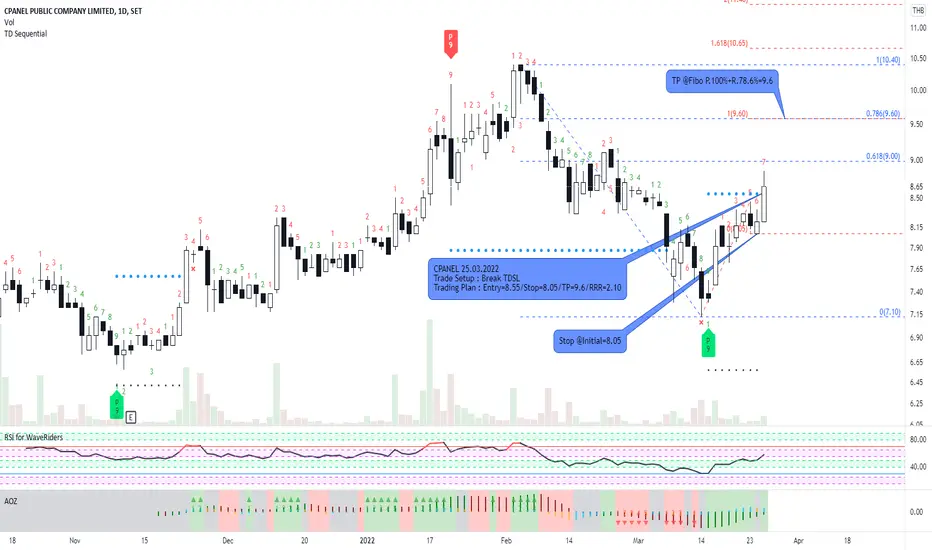
CPANEL and TD Sequential Trade SetupTD Sequential is one of my favorite technical tool for trading. I use it for both reversal pattern and trend following entry. In case of this stock, it could make the close price above TDST Level as the dynamic resistance. When it broke the resistance, I triggered entry at this level, made stop loss at initial point and TP at clustering fibonacci levels. RRR is alright for trading plan while winning rate is rather high according to my previous records. Good Luck!
ITD : Fly or Die ? I'm wondering about this in wyckoff //
and i felt like mentally exhaust with this stock
(which is according to accumulation events)
whenever u have these kind of feelings then it's planning to fly
.
Although the descending triangle can be up or down breakout
and i don't see any bright future in world/country economic yet...
we'll see how this goes
.
Buy after break out :P

KTC | Symmetrical Triangle Squeezed Breakout Trading SetupPrice action and chart pattern trading setup
> symmetrical triangle with squeezed accumulation in the upper zone
> Possible upcoming breakout for medium-term uptrend during Thailand re-opening and rising interest rate
> Target 0.5 and 0.786 retracement zone
> Stop zone at 2nd lowest point of triangle zone for medium-term and the lowest point of triangle for long term trade
> Risk Reward Ratio: 2:1 for medium-term and 3:1 for long term trade
Always trade with affordable risk and respect your stoploss

TTCL (Set) - Elliot Wave AnalysisSpotted a non-standard correction in the monthly time frame. This pattern has a min. tp of 61.8% of the last abc.
Ps. This is a TP in a large time frame, suggesting this level could take a bit of time to reach (months to years).
