OSP | Bullish Dragon Pattern | Target Estimated TFWPrice action and chart pattern medium to long-term trading -
> Bullish dragon triangle pattern tail swing - 1st target achieved at Dragon Ridge 0.5 - 0.618
> Next Target Dragon Hump estimated at Fibonacci 0.618 - 0.786
> uptrend reversal pattern - SMA200 and SMA400 crossed up in timeframe Day
> Buy on dip recommendation at support level SMA400 and SMA200 35 - 36.
Indicator TFW:
> MACD golden crossed signal and approaching baseline 0.
> RSI strong bullish above MA
Always trade with affordable risk ratio 3:1 for long term setup and respect your stop loss.
Good Luck

IP | Estimated 5th Elliott Wave Target Zone ProjectionPrice action and chart pattern trading
> Target projection of upcoming wave 5 estimated from Fibonacci 1.618 retracement of Wave 4 - A and equal to 2.618 of Wave 1.
> Minimum target 1.618 extension of minor wave 1.
Always trade with affordable risk ratio 3:1 for medium or long term
Respect your stop loss.
Good Luck

TRUBB| Falling Wedge Breakout |Impulse Elliott Wave 5 ProjectionPrice action and chart pattern trading
> Bullish parallel breakout and pullback
> Entry position at pullback support level just above SMA200 or volume profile point of control line - 2.70, 2.60
> Mid / Long term Target Elliott Wave 5 estimated 2 scenarios based on 1.0 of wave 1 optimistic and 1.618 of wave 4 as minimum case
> Short term target at top of wave 3
Indicator:
> Strong smart money and banker chip volume
Risk ratio 3:1 for mid/long term and 1.5:1 for short term
Always trading with affordable risk and respect your stoploss

AI | Parallel Channel Breakout | Pullback Entry PositionPrice action and chart pattern trading - Possible the end of Elliott Wave collection phase
> Parallel Channel breakout
> Pullback entry position is recommended
> Target SMA200 as key resistance or Volume profile point of control
> RR: 2:1
Indicator: strong RSI and MACD bullish divergence
Always trading with affordable risk and respect your stop

B | Possible Bullish Wedge Reversal | Pullback EntryPrice action and chart pattern trading
> Downtrend flag parallel channel with bullish wedge reversal pattern
> Entry at pullback position
> Target at upper parallel channel
Indicator:
> RSI and MACD Bullish divergence
Always trading with affordable risk and respect your stop

AGE | Bear Butterfly Harmonic | Limited upside Take Profit 50%Price action and chart pattern trading
> Bearish butterfly harmonic pattern limited upside
> Take profit 50% long term uptrend
> Target downtrend at B position of butterfly / EMA10 / Fibonacci 0.618
Always trading with affordable risk and respect your stop loss

LANNA | Inverted Head & Shoulders | Entry SetupPrice Action & Chart Pattern Trading
> Inverted Head & Shoulders forming | Entry @ Demand support line zone (right shoulder) crossing up EMA200 and SMA200
Indicators:
> Smart Money and Banker Chip volume support
> BBD crossing up baseline
> Fundflow turning positive in-flow bullish signal
> KDJ bullish changing to uptrend ribbon
Trading with affordable risk ratio 3:1
Always respect your stoploss
Good Luck


SOLAR | Downtrend Descending Triangle | Bullish Divergence |WaitPrice Action & Chart Pattern Trading - No Entry Point - just wait and see
Downtrend descending triangle with bullish divergence signal
Indicator:
> Smart Money and Banker Chip volume support at a significant level
> Fund Flow bullish divergence
> BBD downtrend dead crossed baseline
> KDJ stochastic downtrend with bullish divergent signal
Recommend NO trading until breakout EMA400 with trend reversal pattern.

TKN | possible breakout but upside limited bearish divergencePrice Action and chart pattern trading - possible breakout but upside limited
> Testing the upper limit of uptrend parallel channel and key resistance of volume profile
Indicator
> Bearish divergence signal: Fundflow, BBD, and KDJ Stochastic
> Strong volume support with smart money and banker chip of this wave

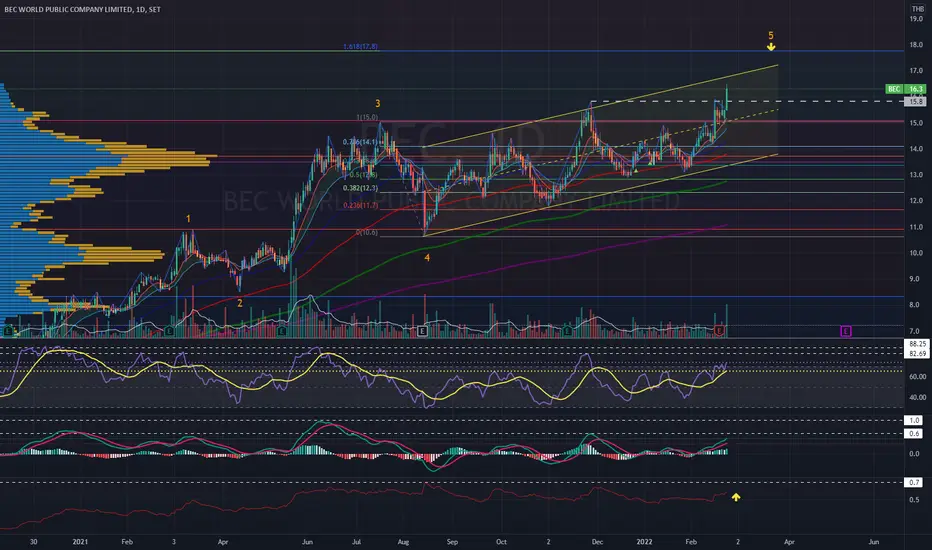
BEC | Uptrend Parallel Channel | Target 5th Wave ProjectionPrice action and chart pattern trading
> Parallel Channel uptrend pattern from Wave 4 to 5 now almost hit the top of the channel.
> Wave 5 target estimated at 1.618 Fibonacci retracement of wave 4
Indicator:
> Target RSI 82 - 88 now at 74
> MACD 0.6 - 1.0
> ATR 0.7 - currently at 0.6

JR | Falling Wedge Breakout | Entry Setup TF4HPrice Action and Chart Pattern Trading
> Possible bullish wedge reversal breakout in timeframe 4H
> Entry @ Breakout trendline and stop zone accumulation
> Target @ Volume Profile POC level Fibonacci zone 0.786 - 1.0
> Risk ratio 2.5: 1
Indicator:
> Smart Money and banker chip significant volume support
> Fund Flow bullish divergence
> KDJ uptrend reversal pattern
> BBD golden crossing baseline
Always respect your stop-loss


CHG on 22 FEB 22Follow covide trend in Thailand and break support
have Vol in TF D , should follow buy and cut loss not high

VL | Cup & Handles | Target Estimated | Elliott Wave UpdatedPrice Action & Chart Pattern Trading Setup
> Entry @ Breakout ascending triangle
> Cup & Handles pattern with target estimated for medium-term trading
> Updated Elliott Wave pattern for daily timeframe
> Trade with affordable risk ratio 3:1 for medium-term
> Always respect your stop-loss

RCL | Bull Dragon Pattern | upcoming Triangle Breakout SetupPrice Action and Chart Pattern Trading Setup
> Bullish Dragon Pattern with upcoming triangle breakout ENTRY setup above EMA200 and Volume Profile Point of control 44.50
> 1st Target upcoming TAIL HOOK fibo 0.5-0.618
> 2nd target at DRAGON HUMP 0.618-0.786
> 3rd target DRAGON HEAD 0.786-1.0
> Tail extended target DRAGON HORN ZONE 1.0-1.618
Indicator:
> Smart Money and Banker Chip important level support at Triangle A position
> Fund flow trend reversal into positive distribution phase
> KDJ Stochastic strong uptrend
> Banker BBD positive trend above baseline 0
Fundamental Factor:
> positive BDI index +5% vs last week above 2000.
> CCFI Container Index still at high level
en.macromicro.me
Risk ratio: 2.5:1 for short term target tailhook position or dragon hump trade and 3:1
Always trade with affordable risk and respect your stop loss
Good Luck

OR, KCE, PTT : SET INDEXStock : Set Index.
OR just broke it's trend line and testing the resistance as present on chart.
KCE support
And PTT now at supply zone, If break the heading up to the target as written on chart
.
Trade safe and fun
\DYOR from many sources before trade :P

SOLAR | Rising Triangle | Entry Breakout Setup Price Action & Chart Pattern Trading
> Rising Triangle | Buy @ Breakout above EMA400
> Target zone @ Volume Profile high D-shape Point of Control - Fibonacci Retracement 0.786
> Stop Zone @ the lowest triangle
Indicator Support:
> Smart Money and Banker Chip Volume
> BBD signal - positive above baseline
> Fund flow reversal pattern still below entry position
> KDJ uptrend ribbon
Trade with affordable risk ratio 3:1
Always respect your stoploss

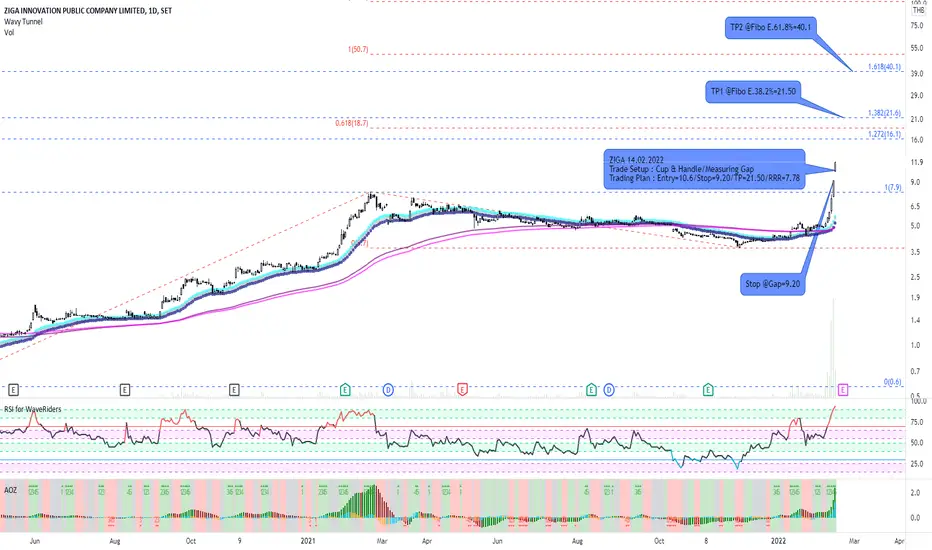
ZIGA and Cup & Handle PatternI like the Cup & Handle. When finding this pattern, I always look for another entry signal because it's strong uptrend and hard to wait for dipping. Luckily, I find a measuring gap called the gap of opportunity. When market opening, I was not hesitated to calculate position size quickly and made entry order. What will be the result, just wait and see. :o)
BROOK | Pennant Breakout | Entry @ Pullback SetupPrice Action and Chart Pattern Trading Setup
> Pennant Breakout and above Volume Profile POC line
> Entry @ Pullback setup - Target 0.786 - 1.0 of previous high - the key resistance of volume profile
Indicator:
> Smart Money and banker chip volume support at previous low / B position lowest pennant
> BBD bullish signal crossover base line
> Banker Fundflow strong uptrend and not overbought
> KDJ stochastic uptrend reversal
Risk Ratio: 2:1 stoploss at C position previous low pennant

NER | Rising Triangle Dragon Pattern | Entry @ Breakout SetupPrice Action and chart pattern short-medium term trading
> Rising Triangle Dragon Pattern
> Entry @ breakout trend line SMA 200
Indicator:
> Bullish RSI crossing MA line above 50
> Rising MACD just below baseline
> CMF reversal crossed baseline 0.
Short term RR 2:1 Medium-term RR 3:1
Always respect your stoploss

