PTT | Big picture | Symmetrical Triangle TFWPrice Action & Chart Pattern Trading
I don't know why I kept this stock for a few years and didn't take profit. This symmetrical triangle has been going on for 2 years++ and coming to a considerably narrow down for breaking point. Hopefully, it will make some sense at the end.
Trade with affordable risk ratio
Always respect your stop

HANA : SET INDEXTarget .
Let's see how this play out
.
Feel free to comment & share ur idea
Prediction is prediction it can be right or wrong
Trade safe n fun!

STGT | Symmetrical Triangle | Entry @ Breakout Setup TFWPrice Action & Chart Pattern Divergent Trading - weekly timeframe
> Symmetrical Triangle pattern - Entry at Breakout high resistance of triangle
> Divergent Trading Signal
> Target zone at volume profile point of control
> Trading with affordable RRR | 4:1 for long term investment
> Always respect your stoploss

WAVE | Jacuzzi Bathtub | Big picture long-term uptrend targetPrice Action & Chart Pattern Trading
> Estimated long term cup&handles pattern target in weekly timeframe as big picture.

ITD : SET INDEXLet's see how this play out
.
Feel free to comment & share ur idea
Prediction is prediction it can be right or wrong
Trade safe n fun!

MACO | Bullish ABCD Harmonic | Entry Breakout Setup Price Action & Chart Pattern Trading
> Bullish ABCD Harmonic pattern
> Entry @ breakout
> Volume profile - lower D shape POC key support
Indicator:
> Banker Smart Money Volume
> BBD positive cross above baseline in 4H timeframe
> Banker Fundflow positive reversal pattern
> KDJ strong uptrend ribbon
Trading with affordable risk ratio 3:1
Always respect your stoploss


SONIC | Inverted Head & Shoulders | Entry Setup | TF4HPrice Action & Chart Pattern Trading
> Confirmed Inverted Head & Shoulders in 4 hour timeframe
> Entry Zone@Breakout Setup
> Target Zone @ Volume Profile Point of Control
> Stoploss Zone @ Neck Line to right shoulder
Indicator signal support:
> Smart Money and Banker Fund Volume
> BBD bullish signal golden cross baseline 0
> Fundflow reversal signal confined
> KDJ uptrend reversal purple ribbon
Trade with affordable risk ratio 3:1
Always respect your stoploss
Good Luck

TIDLOR : SET INDEXEverything is on the chart.
no financial advice
Trade safe and fun
Feel free to comment/share ur ideas

RS | Bullish Wedge Breakout | Entry @ PullbackRS | Thailand SET Index | Media | Commerce Sector | Price Action Trading
Chart Pattern: Falling Wedge Bullish Reversal
Price Action: Entry @ Breakout Pullback
Indicator:
Volume profile strong support Stop-loss position and possible for uptrend price jump
RSI: slight bearish divergent indicating short term price pullback - buy opportunity
MACD: bullish golden cross signal line above baseline 0
Trade with affordable risk ratio 3:1
Always respect your stoploss
Good Luck
DP

KEX : CHEAPER THAN ITS IPO NO TRADING ADVICE
This one is real pain (for me)
will take long time to recover n gain trust + a lot of competitors

OR : SET INDEXI'm bored of crypto market lately...
Feel free to comment n share ur ideas
-
Trade safe and fun


NYT | DOUBLE BOTTOM BREAKOUT | ENTRY SETUP TF4HPrice Action & Chart Pattern Trading - timeframe 4H
> Double bottom - strong momentum breakout candlestick
> Entry @ PULLBACK zone position
Indicators:
> Banker smart money volume
> BBD bullish crossing baseline
> Fundflow ribbon positive change
> KDJ uptrend reversal
Trade with affordable risk ratio 3:1
Always respect your stoploss
Good Luck

CPALL : SET INDEXEVERYTHING IS ON THE CHART
(THIS STOCK IS MOST DIFFICULT TO PLAY, IMHO)
I ONLY STUDY NOT TRADING IT.
PLEASE DYOR :)
.
Feel free to comment / feedback n share ur idea

CBG | Possible upcoming powerful 3-Drive Reversal PatternCBG | Thailand SET Index | F&B Sector | Chart Pattern Trading
Price Action | Entry Position - Buy @ Breakout after pullback above Volume Profile Point of Control (POC) or EMA200
Chart Pattern | Possible upcoming powerful 3-Drive Harmonic Reversal Pattern
Indicators:
>RSI - Bullish Divergent
>MACD - Bullish Divergent
Speculative buy for bullish divergent along the way is also possible.
Always respect your stop-loss
Good Luck

SCC : SET INDEX (MONTHLY VIEW)Everything is on the chart
feel free to feedback / comment
Trade safe and sanook

MINT : SET INDEXMinor group is hotel and restaurant business that got impacted from covid and recovering
but i think it wouldn't go far i'll paste the monthly chart below and u'll see big resistance that it never break..
trade safe and fun.
Feel free to feedback / comments and share ur knowledge

SCGP : SET INDEXEverything is on the chart,
wait until weekly candle confirm, but weekly MACD doesn't look good
.
I still have to manage the stock portfolio even though im not really in it.
Feel free to feedback / comment and share ur ideas.
Thank you

AOT : SET INDEXThis is monopoly business stock,No competitors.
Airports of Thailand.
In the past if there's no covid then it'll just keep growing & growing
Now it has been effected and froze by COVID long time.
Hopefully see the break up soon when the world gets better

BH | 1st Target Reached | Triple Top Pattern - Take ProfitBH | Thailand SET Index | Health Care Sector | Price Action Analysis
First Target Reached with triple top chart pattern - Take Profit recommendation - Sell 50% or all out
> Currently forming downtrend wedge pattern structure.

SVOA | Bullish Anti Nenstar | Falling Wedge Reversal Entry SetupThailand SET Index | ICT Sector | Price Action & Chart Pattern Trading
> 1 Hour Timeframe - Anti Nenstar Bullish Pattern with Falling Wedge Reversal Pattern | ENTRY@BREAKOUT setup
Indicator:
> Smart Money Volume support
> Bullish divergent BBD crossing up baseline 0.
> Banker Fund flow Entry position
> KDJ Sto - uptrend purple ribbon
Trade with affordable risk ratio RR| 3:1
Always respect your stop-loss
Good Luck

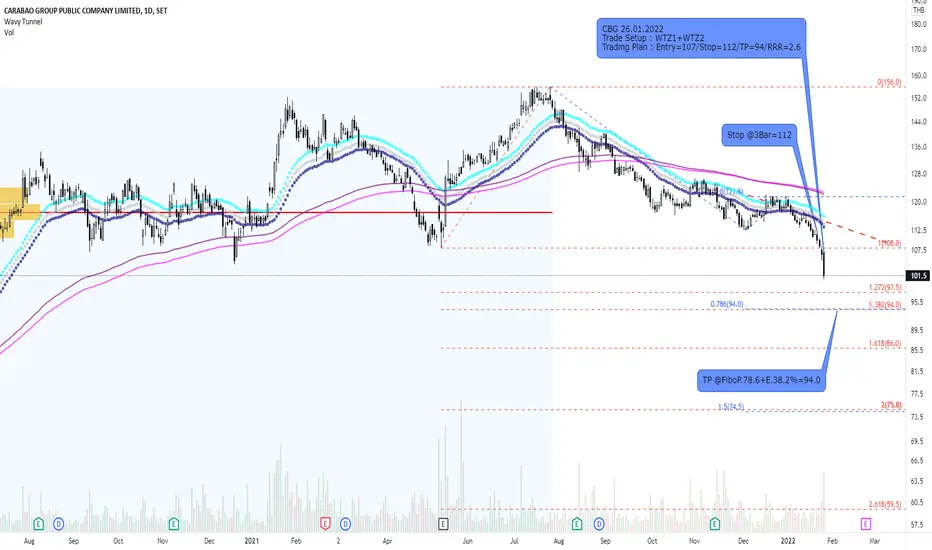
CBG and WTZ1/WTZ2 in multi TF.CBG and WTZ1/WTZ2 in multi TF. I measure the target price at two potential levels as illustrated on the chart. Good Luck