LULU Another Bullish Divergence but this time, it is different!!Good Day Trader!
LULU again showed a bullish divergence. What is different this tie? We have huge volume. which is a positive sign and soon we may see the Stock price rise after some consolidation. To have less risk we may plan to enter after the break out of the last Higher High as shown in the chart. Or we can take some positions in the consolidation for higher risk to reward ratio.
Thank you for following the channel, will to posting more charts.
Happy Trading!
ADCB – Quick 6% ScalpAbu Dhabi Commercial Bank (ADCB) is showing strong momentum after reclaiming 12.52 AED. Price is currently trading at 13.48 AED, pushing aggressively toward the next key level at 14.32 AED, which stands as a major resistance zone.
📌 Target : 14.32 AED (Major Resistance)
📌 Scalp Gain: +6%

EAND – Gaining Momentum for the Next MoveEtisalat Group appears to have bottomed, establishing a key accumulation range between 15.74–18.58 AED. Price is currently playing within this range, building a solid base after a prolonged downtrend.
If Etisalat breaks above the 18.58 AED resistance with strong volume and follow-through, it opens the door to a clean upside move toward the next key levels:
T1: 20.14 AED
T2: 22.24 AED
T3: 25.88 AED
T4: 28.70 AED
The structure is tight and range-bound, but the market sentiment shows early signs of strength. A breakout from this base would confirm a shift in trend and could trigger a mid- to long-term bullish leg.
📌 Risk management: The 15.74 AED level serves as the invalidation zone. As long as price holds above it, bulls remain in control of the setup.

uptrend for #burjeelBURJEEL holding in #ADX market after reach to demand area 1.20~1.30 AED per share now start a Uptrend.
long position is recomanded with the SL 1.20 AED
if the downtrend line break price can reach 1.48~1.50 AED very soon.

#talabat #DFM #dubai_financial_Markettalabat is hitting to a good support @ 1.20~1.25 and now uptrend again
current price is 1.33 and can reach to 1.50 very easily
if you buy put the SL at 1.20 AED

Is DFM a good buy? (Dubai)Why You Might Consider Buying
Fundamental tailwinds
-Dubai's economy is seeing strong growth, with GDP rising and non-oil sectors performing well. FDI inflows remain high, and tourism is growing (~16.8 m visitors in 2024).
-Exchange revenue is benefiting from rising trading volumes, even as clearing fees decline.
-It seems that each time DFM creates a new low, we get a nice pump from it, but this pump seems to get smaller each time it occurs.
Why Caution Is Warranted
Geopolitical volatility
-Regional tensions (Middle East conflicts).
Real estate pressure
-Fitch warns Dubai property prices could fall by double digits later in 2025–26 due to oversupply (~210k new units).
-Disclaimer: This analysis is for informational and educational purposes only and does not constitute financial advice, investment recommendation, or an offer to buy or sell any securities. Stock prices, valuations, and performance metrics are subject to change and may be outdated. Always conduct your own due diligence and consult with a licensed financial advisor before making investment decisions. The information presented may contain inaccuracies and should not be solely relied upon for financial decisions. I am not personally liable for your own losses, this is not financial advise.

BILDCO (ADX) Bulls are Loading🔥 BILDCO (ADX) – 2H Timeframe
“BILDCO just dropped the hammer with that BOS confirmation. ABC correction’s done, accumulation is real. Bulls are loading. With structure flipping bullish and a clean Wave 3 setup in motion, this could rip hard to 1.30+.”
Elliott Wave Breakdown:
✅ Completed ABC correction into Demand Zone
🔺 Wave (1) and (2) of new impulse appear complete
✅ Break of Structure (BOS) confirmed at 0.745
🔼 Bullish trajectory projecting into Wave (3) → (4) → (5) targeting 1.30–1.38
🎯 Trade Setup
Parameter Level
Entry 0.76 (current zone)
Stop Loss Below 0.74 (BOS zone)
Take Profit 1.30 / 1.38
Risk/Reward ~1:3.5+
“Structure tells the story. Volume confirms the chapter. The wave shows the climax.”
⚠️ Disclaimer
Educational content only. This is not financial advice. Trade at your own risk and use proper risk management.

A possible trend change after a 3-year slideEAND has been in a downtrend since April 2022, but we could be witnessing the start of a reversal into an uptrend. Price has been consolidating since the beginning of 2025 and now shows signs of a breakout, supported by a strong recent earnings report.
Key Highlights
✔️ Robust earnings growth
✔️ Strong balance sheet
✔️ Technical setup showing breakout potential
✔️ Positive sentiment returning to the sector
This could be a turning point for EAND, a break above key resistance may signal further upside.
Do your own research and manage risk accordingly.

Big Disappointment LULU is one of the stock in Abu Dhabi Securities Exchange that has disappointed many investors and traders. Right from the successful IPO everyone had a high hope for good returns from this stock and it did exactly the opposite. After the listing it could not take off we are seeing selling pressure almost everyday, Red candles are printed all over the chart. I was watching 1.28 zone very closely for a bounce but still no buyers are interested at current levels. My next area of interest is between 1.17-2.00 if we can see some buying pressure with good volumes i would take small position and wait for more price action to add more quantities. Overall of course its in a down trend.
Hit the like button and show your support guys ;)

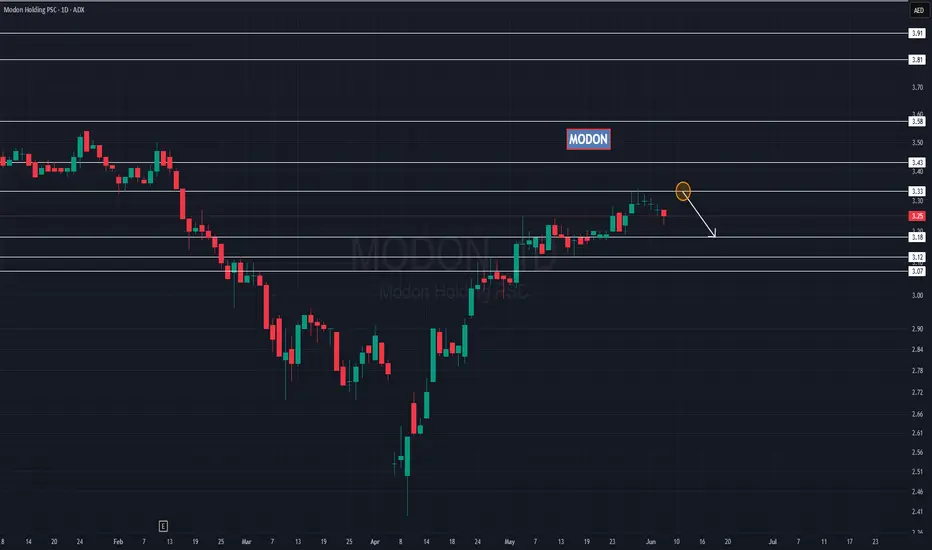
Wait for lower priceModon and Multiply most of the time go side by side, as Multiply has already started its correction i think Modon will also follow. I am not interested at current levels as it got rejected at 3.33 that i have identified as resistance zone. I am waiting for the price to hit somewhere between 3.12-3.18 zone and wait for a bullish signal so that i can plan my entry. As of now lets just wait and watch.
Hit the link button to show your support guys ;)
Watch Out Correction Is hereWe had nice bullish momentum in this stock lately, now its time to watch out as it has hit the resistance and got rejected with big volumes clearly its a supply zone that is 2.40 so if at all you are still holding this stock plan your positions accordingly. I would be interested to watch the price action at 2.10 zone. I think it will soon give us a new buying opportunity lets hold on to our cash and be ready.
Hit the link button to show your support guys ;)
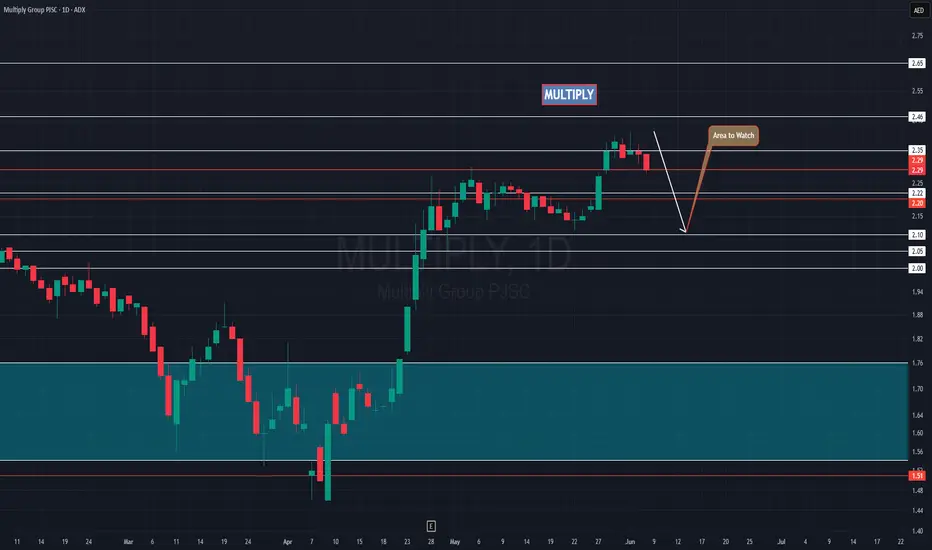
Multiply - Abu Dhabi Stock MarketAfter a long downtrend finally we are seeing some bullish momentum in Multiply. With todays candle closing i am not planning for any entry instead i think people will start to exit at current levels. After this recent rally from 1.50 zone i think its time for a small correction i think it will not be very deeper. Lets wait and see how the price unfolds at next support zone to plan our trade.
Hit the link button to show your support.

Bearish triangle for SALIKDFM:SALIK is looking to begin its descent after a great bullish period. Breaking down from this triangle means it looks forward to touching its support at 5.45 and later 5.18 if lucky for some good buy opportunities.
Watch out!

EMAAR Properties (Dubai)Emaar Properties, a leading real estate developer based in Dubai, has demonstrated robust financial performance in 2024, achieving record-breaking figures across various metrics.
Financial Performance:
Revenue: Emaar reported its highest-ever revenue of AED 35.5 billion (approximately US\$9.6 billion) in 2024, marking a 33% increase compared to the previous year.
Net Profit: The company's net profit before tax rose by 25% to AED 18.9 billion (US\$5.1 billion), reflecting strong operational efficiency and profitability.
Property Sales: Emaar achieved record property sales of AED 70 billion (US\$19 billion), a 72% increase over 2023 figures.
Revenue Backlog: The company's revenue backlog from property sales surpassed AED 110 billion (US\$30 billion) as of December 31, 2024, indicating robust future revenue streams.
Balance Sheet and Financial Ratios:
Total Assets: Emaar's total assets increased to AED 160.2 billion in 2024, up from AED 139.4 billion in 2023.
Total Equity: The company's total equity rose to AED 96.1 billion in 2024, reflecting a strong capital base.
Debt Levels: Emaar's total debt stood at approximately AED 9.6 billion as of the most recent quarter, with a debt-to-equity ratio of 10.5%, indicating prudent financial leverage.
Strategic Developments:
Dividend Policy: In December 2024, Emaar announced a new dividend policy, proposing its highest-ever dividend of 100% of share capital for 2024, amounting to AED 8.8 billion.
Land Acquisition: The company acquired 141 million square feet of development land in prime areas of Dubai, with a total development value of AED 96 billion, positioning itself for sustained growth.
Market Position and Outlook:
Emaar's strong financial performance in 2024 reflects its resilience and adaptability in a competitive real estate market. The company's strategic initiatives, including significant land acquisitions and a generous dividend policy, underscore its commitment to delivering value to shareholders. With a substantial revenue backlog and a robust pipeline of projects, Emaar is well-positioned to maintain its leadership in the real estate sector.
-*Disclaimer: This is just my personal opinion and not financial advice. I am not a professional financial advisor. Please do your own research before making any investment decisions. Any losses incurred are solely at your own risk.*

LULU (ADX) The correction’s cooked!!🔥 LULU (ADX) – 1H Timeframe
Lulu Retail Holdings PLC
“LULU just cracked structure at 1.34 and flipped the script. The correction’s cooked, momentum’s shifting, and the bulls are looking to ride this wave straight into those stacked supply zones. Stops are tight, upside’s clean — this is where the move begins.”
🧠 Elliott Wave Breakdown
🔁 Wave (1) and (2) appear locked in
✅ Break of Structure (BOS) above 1.34 confirms bullish reversal
🔼 Price now riding Wave (3) with pullback forming Wave (4) setup
🔺 Final target projected in Wave (5) zone at 1.79 – 1.84
🎯 Trade Setup
Entry 1.35 (current zone)
Stop Loss (tight)** Below trendline @ ~1.31 (for conservative traders)
Stop Loss (wide)** 1.25 (below demand zone for higher tolerance)
Take Profit 1.79 – 1.84
R/R Ratio ~1:3.2 – 1:4.5
“All structure, no noise. When price breaks out and retests clean, you either trust the wave or stay flat. That demand zone held — now let the market do its job.”
⚠️ Disclaimer
This analysis is for educational purposes only. Not financial advice. Use stop-loss strategies that fit your risk profile.

DUBAI ELECTRICITY (DEWA) running a clean Elliott🔥 DUBAI ELECTRICITY (DEWA)
“DEWA’s running a clean Elliott textbook: ABC down, new impulse up. The bulls stepped in hard at the C-wave low — textbook demand zone reaction. Now riding Wave 3 with momentum, and 3.06 is the magnet.”
### 🌀 **Elliott Wave Breakdown**
* ✅ Completed impulse: Wave **(1)-(5)** topped near **2.90**
* 🔻 Correction: **ABC** Zigzag down to strong demand zone (**C** low = liquidity sweep)
* 🟢 New bullish impulse unfolding:
* Wave **(1)** and **(2)** of the new cycle complete
* Currently riding Wave **(3)** targeting **2.88(Wave 3), 3.06 (Wave 5)**
* Smart money likely stepped in at Wave (C) low
* **3.06:** Target zone & projected Wave (5) high
---
### 🧮 **Fibonacci Extension**
Wave (3)target ≈ **2.87 –
Wave 5 target 3.06
## 🎯 **Trade Plan**
| --------------- | ----------------------------------- |
| **Entry** | Market @ 2.72 or pullback near 2.60 |
| **Stop Loss** | Below 2.43 (demand zone) |
| **Take Profit** | 3.06 (Wave (5) projection) |
| **Risk/Reward** | \~1:3.2 |
*“The market moves in waves. Ride the impulse, survive the correction.”*
### ⚠️ **Disclaimer**
> This is an educational analysis, not financial advice. Always use a stop loss. DYOR before entering any position.

SALIK (DFM) BOS confirmed the bulls are back in charge### 🌀 **Elliott Wave Structure**
* The stock completed a textbook 5-wave impulse (1 → 5).
* Followed by a complex **ABCDE correction**, ending with a liquidity sweep on Wave (E).
* Current price action is a **bullish breakout** — likely the start of a **new impulsive cycle**.
### 📐 **Fibonacci Extension Target**
* **7.35 = 100% Fib extension** of previous impulse (Wave 1–5), projected from Wave (E).
## 🎯 **Trading Setup**
| **Entry** | Market @ 5.90 |
| **Stop Loss** | Below 4.75 (beneath main OB) |
| **Take Profit** | 7.35 (100% Fib extension ) |
| **R/R Ratio** | \~1:3.6 |
---
> “SALIK finally ripped through resistance like butter. BOS confirmed the bulls are back in charge. That 7.35 target? It’s not just a guess — it’s fib math.”
> *“Fibonacci is the map. Price is the vehicle. Volume is the fuel.”*
---
### ⚠️ **Disclaimer**
> This is not financial advice. For educational purposes only. Always manage risk and use stop losses. Past performance doesn’t guarantee future results.

DUBAI TAXI COMPANY (DTC) Riding The Ascending ChannelDTC’s bouncing clean off the old resistance, now strong demand. Classic flip. Riding within an ascending channel, eyeing 2.75+ — just needs volume to push through
### 🟢 **Support Turned Demand Zone**
* The **previous resistance zone** around **2.33 – 2.42** has flipped into a **strong support/demand zone**.
* Price dipped into this zone and sharply bounced, confirming **buy-side absorption** at that level.
* Classic **S/R Flip** behavior – ideal for long setups.
* **Ascending channel** is developing — price respecting both upper and lower trendlines.
* Higher highs and higher lows = bullish structure in play.
* Channel is guiding price towards **next resistance/supply levels**.
### 🟡 **Supply Zones**
* **2.75 – 2.85**: Marked supply zone with heavy volume profile clusters — likely profit-taking or institutional selling pressure.
* Expect some turbulence or partial TP in that area.
---
### 📉 **RSI Perspective**
* The bounce from demand zone came with **low RSI** — signaling **bullish divergence** or **oversold** conditions
* Another bullish technical confirmation for current long bias
---
## 🎯 **Trading Plan**
| **Entry** | 2.54 – 2.56 (channel support retest) |
| **Stop Loss** | Below 2.42 (under demand zone) |
| **Take Profit ** | 2.85 (major supply zone) |
| **R/R Ratio** | Approx **1:2.8** |
---
> *“Every resistance broken becomes a soldier in the support army.”*
---
### ⚠️ **Disclaimer**
> This analysis is for educational purposes only and not financial advice. Always do your own research and use stop losses.

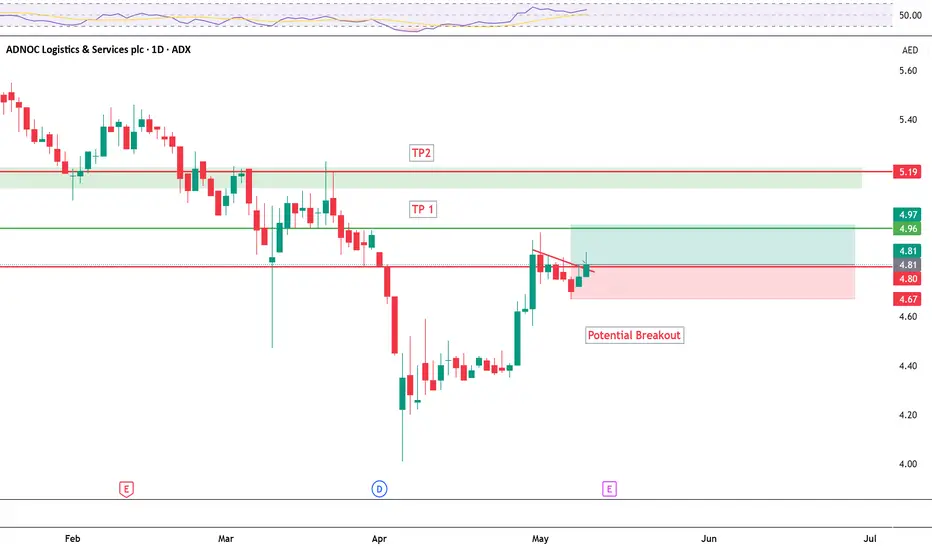
AdnocLS ( Potential Breakout)Adnoc logistics after consolidating for few days looking good for potential breakout.
DFM : DIB - Trade Plan - Good Bounce at Fibonacci RetracementGood Day, Traders!
The Stock DIB at #DFM bounced twice from Golden Ratio of Fibonacci Retracement after providing dividend. This makes the golden ratio a respectable support. The stock is expected to rise from here with few corrections. We may have a profit taking opportunity. Good volumes further enforces this idea. The trade maybe taken now if not taken earlier. Below is a trade plan:
Trade Plan:
Buy: 7.00
Stop Loss: 6.42
Take Profits: 7.68 & 7.92
Happy Trading!

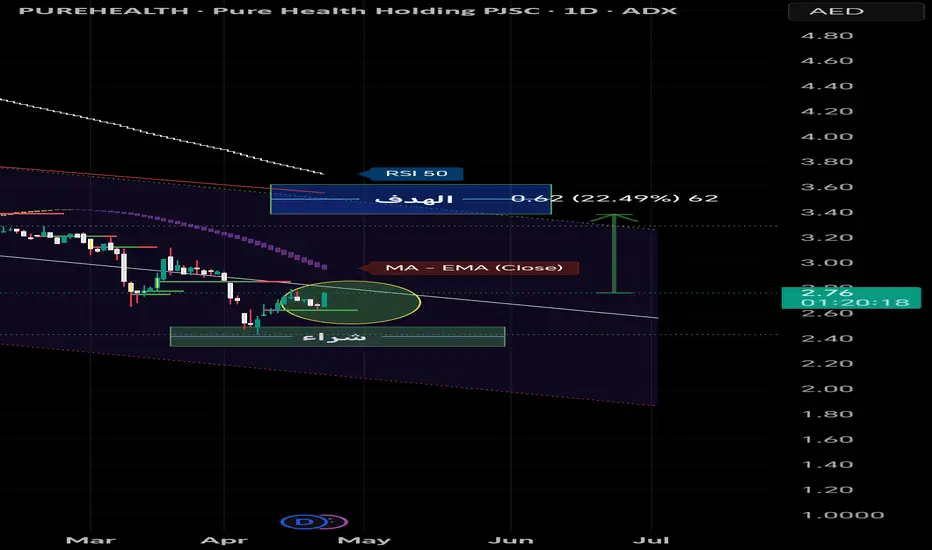
positive for the stockThe analysis is positive for the stock and there is a possibility of a 20% increase.
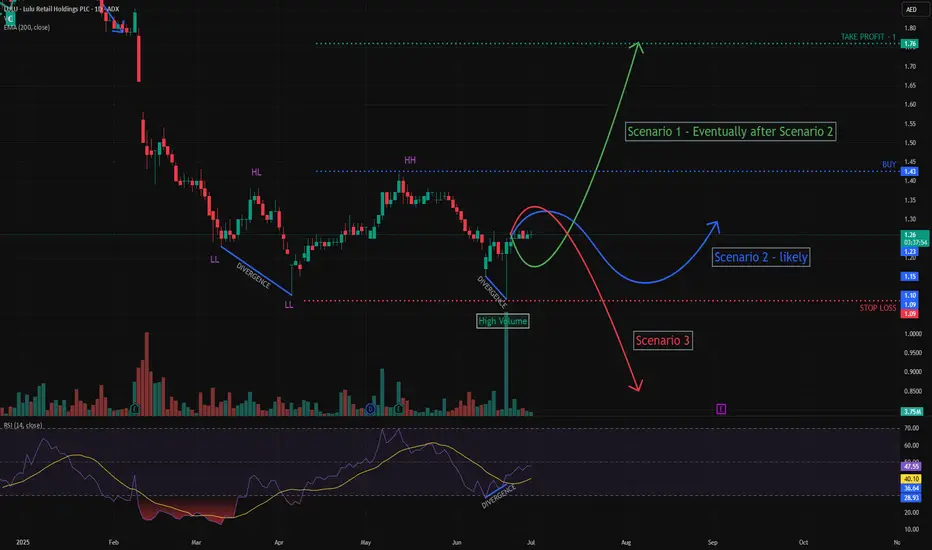
ADX LULU | Bullish Divergence | Possible Reversal | Trade PlanGood Day Trader!
We observe a Bullish Divergence between the last two Lower Lows. There are three scenarios:
Scenario 1: The bullish divergence will take effect and the price will rise.
Scenario 2: The price can go sideways for consolidation.
Scenario 3: The price may ignore the bullish divergence and continue to drop forming new HL and LL.
We will take positions at the breakout. Accordingly refer to the suggested trade plan.
TRADE PLAN
Buy : 1.39
Stop Loss: 1.09
Take Profit: 1.69
Risk/Reward Ratio: 1.0
Follow me for more analysis!
Happy Trading!

ADIB - Price action testing Fibonacci Retracement RatiosThe Price is testing the Fibonacci Retracement levels and is expected to continue uptrend. Good opportunity to buy at these levels. These levels are indicated on the chart.
