Bottomed OUTLooks like Presight is done with down trend and potentially there are good chances that it can reverse from current level. We are seeing fresh buyers joining the club at 2.90 area that is support for now. Double bottoms will be confirmed once we see a breakout and a close above 3.03 once this chart pattern is confirmed then I think it will try to retest major resistance area that is around 3.20
For now its a chance for early bird entry at current levels provided price stays around current levels and does not break 2.88. Plan your trades with proper risk management.
Hit like & follow guys ;)


YAHSAT a chance to make 10% on a stable & very predictable stockADX:YAHSAT
Al Yah Satellite is a company that builds/buys satellites and launches them into space. While it is a public joint stock company, it is really a semi-government company, a subsidiary of Mubadala, with heavy ownership by UAE top leadership.
They currently have 5 satellites in orbit. The satellites basically provide broadband internet service, backhaul (connections between networks), and mobile voice & data service.
This stock moves very predictably for the following reasons:
1) The stock has shares outstanding of 2.44 billion, the float is less at about 975 million shares. Float (shares available for trading and not in the hands of long-term holders) is likely even less than 975 Mil but just not officially disclosed. Meaning more than 60% of the stock are long-term holders.
2) But these are not your average owners. They are not long-term investors looking to make money. They are strategic owners that will never sell. Selling YAHSAT has sovereignty implications. This is a company really that should’ve never been public. It should always be government owned. They are intertwined with defense. Thus, the public portion will always be minor and incapable of impacting the company decisions.
3) The company also essentially has only one customer, the UAE government, specifically the armed forces. It is trying to venture into the commercial markets but still with limited success.
4) YAHSAT has recently renewed their contract with the government that was set to expire in 2026 and now it will expire in 2043. So, they will now have a stable income for the next 20 years.
5) They pay 6-7% dividend every year.
6) The stock is deeply undervalued. It has good financials and a DCF model intrinsic value of 8 dirhams per share (5 yrs our). So, it’s trading at a deep discount (see financials on chart below)
All of the above provides support every time the stock dips. If you look at the chart above, you can see that YAHSAT stock does indeed move very predictably. It zigs up 8-10% and then zags down 6-11%.
Figure 1: chart with key financials and intrinsic value only. For trading signals see the first posted chart.
The company recently announced the good news of renewing their contract with the UAE government for 20 years. Thus, the stock shot up 9%. Now it’s going to correct and drop down by about 11% to the shown cyan arrow. Why? Simple, this company doesn’t have a lot of news. It’s a satellite company! They already made their big announcement. You can buy it earlier at the shown blue arrow and then average down at cyan arrow for a two-tier entry if you wish.
You can place a stop loss at 10% lower for a 1:1 Risk to Reward ratio but I calculate the stop to be reasonably safe at a price of 3.34 AED per share (3.7% stop loss). Profit target is still 10% giving you a reward that’s 3x the risk. Not bad.
One disadvantage is the stock has an ATR of 1.66% per day so it will take it some time to reach 10%. But the future looks bright for YAHSAT. They are going to launch two new satellites by 2028 which according to them will bring in 20 times more capacity than their entire current fleet of 5 satellites. And they have already sold half of that future capacity to the UAE government. The remaining half is available for sale to new potential customers, so there is upside potential.
I will buy YAHSAT at cyan arrow and target a 10% return. This is what I am doing with my money. You do you.
Good luck.

Good SetupThis stock is very stock fundamentally and now we are seeing good technicals on this chart. We are seeing good buying pressure at very important support and resistance zone. I think the rally will continue to the upside and it will hit the targets. This stock also give good dividends, good for long term holding.
Hit like & follow guys ;)

Very ConfusingTrend
No doubt for now upp is under pressure and we are not seeing any buying pressure. People are waiting for the news to get a clear direction. If there is any positive news coming out from upp this stock will fly and it will go past 0.50 very quickly.
If you are holding this stock for now its in a chart pattern and at the support zone. If it breaks then it will turn bearish. So its wait and watch game now with think volumes.
Hit like & follow guys ;)

Potential is thereTrend
Fundamentally this stock is getting stronger and with new projects deyaar is gaining momentum. Unfortunately for now its under selling pressure but its at a very good support area. Immediate resistance for now stands at 0.695 and then 0.705 area.
Once the resistance zone is taken out with good volumes i think sellers will be weak and will not try to short this again as bulls will gain the control over the prices.
Hit like & follow guys ;)

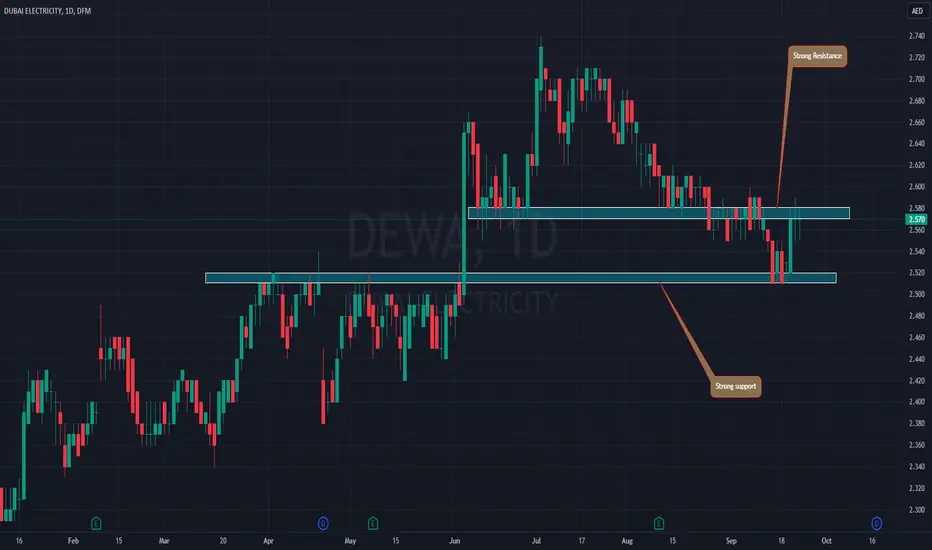
Slow & SteadyTrend
This stocks usually moves slow with thin volumes, since its dividend time many investors would like to take position. For now its stuck between support & resistance zone. I think near dividend date there are good chances it can break to the upside.
For now wait for the breakout of the resistance that is between 2.57-2.60 zone with good volumes.
Hit like & follow guys ;)
Strong Bulls Trending
No doubt that emaar properties is in a strong uptrend, people are just buying at what ever price they can. There was also a news that emaar will pay higher dividends.
Fundamentals
Real estate market is booking in Dubai and with prices going up companies revenue is also leaping many folds.
Retest
Those who have missed this beautiful rally to the upside now they are waiting for a correction including me to buy this stock. With the strong bulls around i think it can retest 38% FIB and resume its uptrend.
I think overall this stock will be very soon above 10.00 very good for long term holding too.
Hit like & follow guy ;)

Do or DieTrend
Multiply is at a very crucial support zone for now that is 3.95-4.00 if this support zone is broken then we can witness more selling pressure and it can retest 3.80 area. Over all trend is still uptrend. Bulls have to flex up and show some power.
Targets
Strong resistance at around 4.10 zone but since multiply has spend so much of time near this zone if we see buying pressure again then there is high probability that it will cross 4.20 with ease.
Hit like & follow guys ;)

Still BullishTrend Identification
Still the up trend is intact, after the strong move from 2.35 zone qholding is now under correction but i think very soon bulls will regain the control. For now its just trading within the channel.
Breakout
Soon i am expecting a breakout, once the price closes above 3.70 i think people will start reentering this stocks with good volumes. For the last 3 weeks we are seeing thin volumes and low trades in this stock.
Buy & hold Strategy
I am still holding my position for the last 3 weeks, I am waiting for the breakout will sell around 4
Hit like & follow for more updates ;)

SELL BOROUGEDear Emirati traders,
2 weks ago, I posted to sell BOROUGE, and as you can see on the chart the price took its way down towards the target sat, you still can sell and set your SL and TP as shown on the chart.
For further questions, don't hesitate to ask!

Will it come down?The trend is still positive, for now Rak Properties is establishing its support zone, I think very soon bulls will charge in and push the price higher. I have bought some quantities at 1.14 will wait for a bullish candle to close above 1.16 to add more. Although it can even come down lower to retest 1.10 area. Will wait for price action at that support to buy more quantities.
Hit like & follow guys ;)

TAQA bullish reversalTAQA is making simple HH and HLs and on its way to recovery from a long bearish trend.
Entry at current price would be a good idea and accumulation at lower prices till 3.25 is also recommended
STop Loss should be 3.15

Hand onI am still bullish on this stock, its still in a uptrend as of now its in a ascending triangle chart pattern. With todays closing it have made a doji right at the resistance creating confusion for tomorrow. But i think its worth taking a chance as this stock has a potential to make big moves. It is good for intra day and swing trade too. Over all this is bullish stock in adx market.
Hit like & follow guys ;)

Correction TimeTrend
Its still trending up, but for now it has hit the resistance at 4.10 area, today i sold multiply at 4.07 but i think it will come down for retest at support zone and this will be a buying opportunity for those who missed it at lower levels.
If it comes around 3.95 lets wait for buying pressure and then pull the triggers.
Hit like & follow guys ;)

Let it comeTrend
Its still in a uptrend but for now its bit extended so a correction is due on this recent rally to the up side. For the last 3 days we are seeing Doji candles at the same place I think it will make a big move very soon.
Support & Resistance
For now next support is around 1.10 zone and resistance is at 1.15 area. I will wait for it to close above 20 day moving average to make a by decision. Tomorrow will be very interesting to see if it can manage to close above the resistance.
Hit like & follow guys ;)

Get ReadyTrend
Overall trend is still intact, qholding is still in a uptrend. But for now its looking very scary its been going side ways for so many days and I think this week it will breakdown (big Move) Since its been just ranging which obviously market does not like.
Break out
Which ever way it breaks out the move will be bigger, if it breaks down those holding their positions will panic sell which will further put pressure on the price. If it breaks to the upside people are waiting to catch this one and ride it.
Support Area
We can see on the chart 3.60-3.65 is holding tight so far but i think it will be broken very soon. Resistance is at 3.80 for now.
Hit like & follow guys ;)

More RecoverTrend
Etisalat is in a strong downtrend for now, for the last 2 days we are seeing some bounce/short recovery. We cannot trust this move as this can be a correction phase of this massive drop to the downside. We wait for a proper bullish price action to take any position.
Fib Level
Watch out 50% Fib level area if we see rejection candles around that area it will be a added confirmation that bears are charging and bulls will have to leave the ground. For now its too risky to take any trade in this unless its quick entry and exit strategy.
Hit like & follow guys ;)

Very CriticalFor now its just goin side ways, very thin volumes traded in this stock. Usually we see big volumes when there is at news that is effecting this stock. For now nothing interesting, if it breaks the current support area that is 19.75-80 area then it can come down for a retest. Other scenario for it to be bullish it will have to break 20.35 and close above it to attract buyers. For now its in a no trading zone.
Hit like & follow guys ;)

PowerfulTrend
It have started fresh trend, price is right near 200 day EMA once it clear sky is the limit. But for now 24.00 is a hurdle.
If it comes down to retest 22.35 i would consider this as buying opportunity. Volumes are now increasing on daily basis looks like people are jumping in.
Hit like & follow guys ;)

Scary & safeTrend
For now its still looking safe and in a uptrend, but i hope its not forming a head & shoulder pattern. If the pattern is confirmed then be ready for a selling scenario till about 3.30 zone
New High
On the other side, if it manages to close above 3.60 this will be a good sign that its ready to go higher and bearish pattern will be invalidated. Over all i am bullish on this stock for now with oil prices going higher.
Hit like & follow guys ;)

Will 200EMA SaveTrend
Its at a bring to establish a downtrend once we see a confirmed close below 200day ema. For now its taking a pause at a very crucial support area if this is broken then we can go down south. For now i am not interested to catch a falling knife, let manazel show us a bullish price action to buy this bad boy.
Hit like & follow guys ;)

Its a PAINTrend
Its been just going side was for ages now, once it breaks 3.46 and closes above with good volumes thats when we can have a trend confirmation. With last weeks closing its looking weak.
Breakout
Once we see a confirmed breakout that's when we can plan out buys for now its in a no trading zone it can retest support 1 and support 2 area. Also the have announced bonds that got listed on ADX this stock is looking good.
Hit like & follow guys ;)
