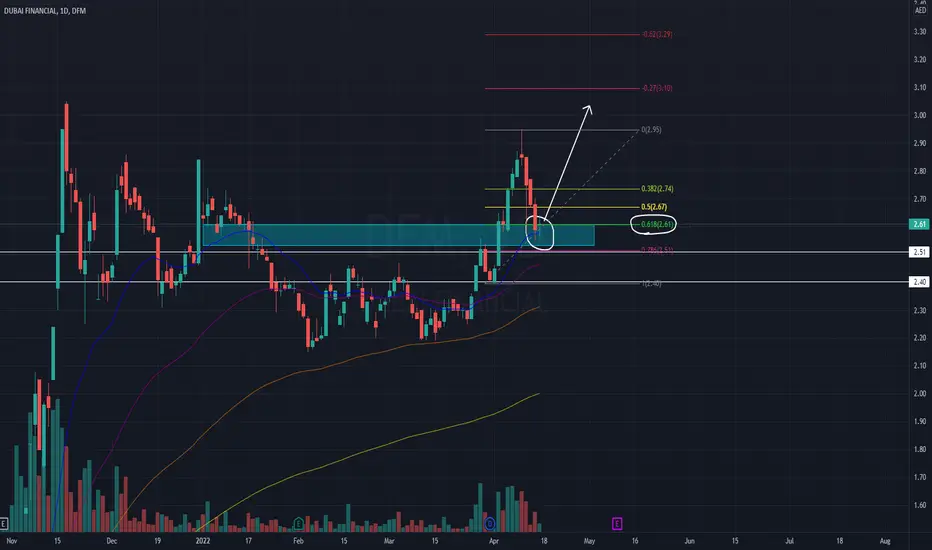
At crucial support levelits been under pressure for the last 4 days after making a big move to the upside. Its now at a important support level we want to see buying pressure to confirm the support level with good volumes. If this happens and we see a candle close above 2.75 W pattern will be activated and most likely this time it will cross 3. For now its in a no trading zone lets wait for a proper setup!!
hit like & follow guys ; )

Confusion ModeLooking at the fundamentals its very strong, it opened with a bang but as of now its under correction mode as still we can see profit booking in play. There are 3 scenario from here either we see a green candle tomorrow to confirm a bullish price action or it will come down to retest 2.75 zone again or it will break the support to go down further to touch 2.60 what ever the case might be over all this stock is a must in our portfolios. If you can grab at lowers levels and hold it you will smile later.
Hit like & follow guys ;)

More is coming HoldonDFM have shown us solid buying pressure right near the support zone, this is what we have been waiting for since the correction started. Todays gap up was first indication that it can fly although i was not expecting this big move but yes i was expecting some positive reaction into the support zone. More IPOs are coming up DFM will benefit the most so its a very good stock to keep it in our portfolios for long term investment. Recommended!!
Hit like & follow guys ;)

Very BullI had mentioned in my last update as well Emaar is very bullish any dip is a buying opportunity. I think Emaar will soon cross 7.00
Go for it highly Reco0mmended!!
Hit like & follow guys ;)

Good To Fly AgainMost likely we can see another rally to the upside its at a good support level a good buying pressure will add another confirmation to our trade idea. For now 20 day moving average is acting as support also golden ration of FIb level is giving us a go ahead. Time to STALK this STOCK very closely.
Hit like & follow guys ;)
Fantastic Bull RunIts been on a solid bull run without any proper correction i think its now time to book the profits as correction is due. Over all this stock is now very strong fundamentally as covid restrictions are now eased which means more revenues for the company.
Hit like & follow guys ;)

Moreits in a strong uptrend after the dividends it have corrected itself and again going for a new bull run. I think soon it will cross the previous high and touch 7.00 over all this stock is very bullish and highly recommended to be in your portfolio.
hit like & follow guys ;)

Not Able To CrossIts been trying hard to cross the resistance of 0.500 but unsuccessful, its now in a correction mode of the strong upside move that started from 0.430 zone. Well if the support that is around 0.480-0.470 is broken then it will again get weak and come down which will be bearish. As of now it will be the best scenario that bulls jump in quickly and take control of the situation. As of now in a no trading zone if you have bought it at the lower level be safe and book the profits.
Hit like & follow guys ')

Get ReadOver all Emaar is very bullish but since Dewa have joined the party Emaar is shying away most of the traders are now shifted to DEWA but Emaar is very strong and its getting ready for the break out. I think it will soon touch 7.00 but before that a small hurdle at 6.40 also dividends are coming up so many investors will like to add more position to their portfolio. Over all in a uptrend!!
Hit like & follow guys ;)

Watchout!!Watchout a strong resistance is at 2.65 but there are good chances it will break as dividends are up and after that i will gap down. It can go down till 2.40 once the dividends are given out. Over all very bullish and in a strong uptrend. Its good time to buy but lets book the profit before the D day.
Hit like & follow guys ;)

26000+ Trades DoneFor the first time I am seeing 26000+ trade done in 1 stock in Dubai Stock Market this is huge!! buying momentum have started from today and most likely it will continue a small retracement can happen which will be a buying or adding opportunity. I think 2.84 level can be retested before going higher. However if the market sentiments are very strong and positive it may continue without any correction. This stock without saying is very good to be in our portfolios. Highly Recommended!!
Hit like & follow guys ;)

UAE Union Properties #UPP Strong buydear Friends
UAE Share As known #Upp Union Properties is ready to jump toward TP Line
RISK/REWARD:1:15 isnt Good?

UAE AJMAN bank Share readyUAE Ajman bank #AJMANBANK ready for Jump
SL: set Below Orange Box
TP1 & tp2: is Depicted

ARAMEX UAE Stock ShareDear Friends
Aramex Share #ARMX Is in First Stage of Flight
1st &2nd targt Defined

Dubai Islamic Band #DIB UAE StockDear Follower
This Share is in good area And We Hope today is Start for Jump to 1st & 2nd Target as Depicted .


Again Disappointment ?We have seen Deyaar has got a habit of surprising the market. Whenever we see its in a “bullish” mode and ready to go higher very same day it will be dumped and closed in RED!!
At times when Deyaar is not expected to make any move it will suddenly close with a solid green candle. Lately its been under pressure and moving side ways most of the time. It was in a bullish chart patter but unfortunately it broke to the down side and now recovering. Deyaar is a “yellow flagged” stock in Dubai Stock Market which means its in a accumulated loss between 20% – 50% of issued capital.
Deyaar is trying to breakout and move higher but facing tuff resistance as we can see on the chart resistance is strong as whenever it tried to cross it was a failure. A strong resistance is at 0.460 0 – 0.465 last weeks closing is at 0.463
I have seen it disappointing earlier so I dont trust this small breakout, volumes are increasing but I would like to see a closing above 0.480 to confirm its resuming its uptrend from here. Over all trend is still to the upside but it was going side ways for all these months. With Emaar Properties leading the real estate sector I thing Deyaar will also follow the suit.
I had recommended right near the support after looking at the bullish price action to have a small stop loss and a good target of 1:4 RR still there is a good chance of it going higher if we take the first green candle as a break out and the next days red candle that is a DOJI meaning indecisive day and then a green candle with a gap down – retest of the breakout.
If on Monday it opens with a gap up there are very good chances we can see a good big move to the upside if, it opens with a gap down I think it will remain around the same level. Both 20 & 50 day moving average are below the price and acting as a support for Deyaar. A close above 0.480 will attract more buyers and it can retest the swing high of 0.540 or if it again fails this time it can come down to retest 0.420 level.
With market sentiments at all time high I hope Deyaar will not disappoint us this time. We want to see big volumes with big moves to the upside coming week.

Break or Fail?Will it break the resistance this time? its been in a range for more than 2 months now!!! as per my analysis i think its high time and it will break the resistance this time. Next target before dividend is 1.35. Looks bullish!!
Hit like & Follow guys ;)

Bullish MomentumGood price action is seen, weekly closing is bullish but a strong resistance is at 2.40 previously it attempted to cross at least 3 times but was not successful. With positive market sentiments in the market I think there are good chances of it crossing and retesting the upper resistance of 2.70
Hit like & follow guys ;)

Bullish Divergence Bullish divergence us seen on daily chart its trying to cross the resistance of 0.450 but its getting rejected as seller are aggressive in that zone. After the breakout down of the descending triangle pattern it found support at 0.430 and its holding it. I think big move will come very quickly in Deyaar as this stock makes big moves on either side. Closing above 0.460 will be bullish as of now its very tricky.
Hit like & follow guys ;)


It will Hit AgainA very heavy weighted stock in Dubai Stock Market, after the dividends its very normal for the price to drop. But the most important thing after the drop is to sustain and bounce back again showing the strength in that company & stock. We are seeing similar kind of reaction from the market its trying to bounce back I think we should wait for a breakout of the sloping trend line and then trigger the trades. Over all its bullish!!
Hit like & follow guys :)

Trying AgainIts trying again to cross the resistance of 2.40 over all its still in a uptrend all the moving averages are below the price which is bullish. If it cross the resistance of 2.40 then next target which is a solid technical resistance 2.50. Over all market is bet slow with low volumes due to the Dewa IPO as people are liquidating their position to subscribe the IPO.
Hit like & follow guys ;)
