Stalk ThisNo doubt this is very strong stock, once it cross 5.43 thats a strong resistance i think this will again go back to the swing high. Over all this is a bullish stock.
Hit like & follow guys ;)

Good For IntradayWell we all know fundamentally this stock is not very strong, but technically it have showed us a buy signal today. Looks good for intraday trade, a quick entry and exit is recommended.
Hit like & follow guys :)

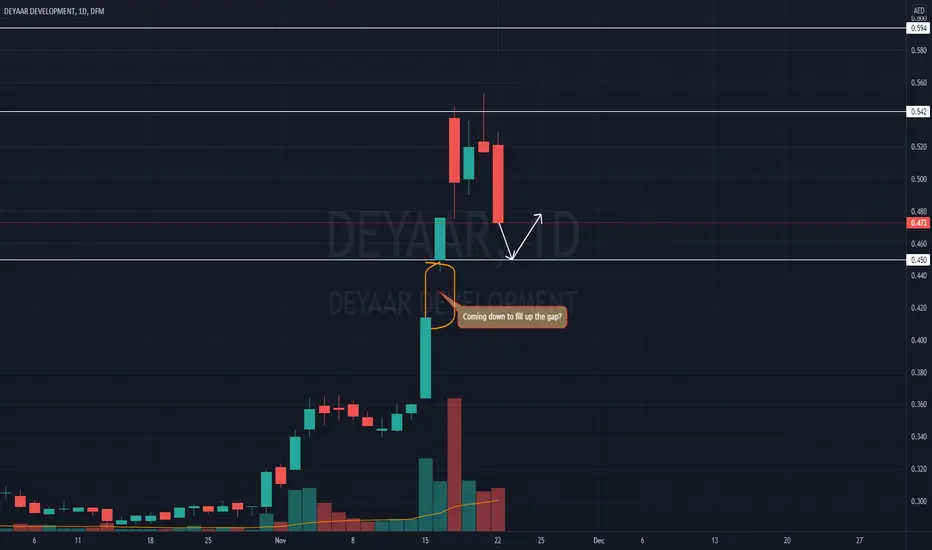
Looks good for a buyIt have tested the support zone so many times and with todays closing i think buyers are in action, it looks good till the gap which will potentially act like a resistance also it can be a TP1
hit like & follow guys ;)

Change in momentumWe can identify a double bottom patter in deyaar which is bullish also it have broken the neckline/resistance and closed higher. With the current scenario in the market with low volumes there are high changes that it may come back for the retest, this will be a buying opportunity for those of have missed the trade. Shift in the momentum is seen lets hope that is sustains the gains. No harm in taking some small quantities.
Hit like & follow guys ;)

Bearish Mode For NowFor now its under pressure more selling will be triggered if it goes below 4.70, strong support at 4.65. If we want see a bullish scenario we can expect market to make a inside day candle tomorrow and later in the week close above 4.90. For now its in a no trading zone.
Hit like & Follow guys ;)

Good for long termThis stock is very good fundamentally and technically as well, also a good stock to be in your portfolio. After a morning start kind of pattern its struggling to cross the resistance that is around 1.22 zone once the resistance is taken out we can see it flying higher. Over all very bullish!!
Hit like & follow guys ;)

Emaar Properties one of the leading developers in the region and one of the stocks I hope to buy in the next cycle after prices drop substantially

EMIRATES NBD BANKTrying to reach this level and we have 75% of probability will break the resistance and we will see highiest prix

Good MoveA very strong stock, still there is a small gap to touch the resistance it can be a good intra day trade. Over all its very bullish!!
Hit like & follow guys ;)

Get ReadyOver all bullish and it have recovered from the previous fall, I think it will make a big move soon to the upside. Its right at the support and at a buy zone sellers have tried to bring it lower but the very next day we can see bulls taking charge and holding the support zone. Very Bullish!!
Hit like & follow guys ;)

Bullish Pattern BreakoutPattern breakouts are very powerful, i was expecting a bigger reaction today after the positive news and the breakout of this bullish chart pattern. Overall still very positive and looks bullish!! Recommended!!
Hit like & Follow guys ;)

Will It Breakout?This stock is very slow with low volumes most of the time, overall insurance sector is under pressure for now. If this pattern gets activated it can be a very profitable trade. This is a bullish chart identified on a weekly time frame so the effect can bigger. Its in a range since so many weeks if it breakout positive the impact will be very big. Looks bullish!!
Hit like & follow guys !!
wait wait wait the next up or down change will decide the next step
wait and watch for the rise
tomorrow if the market closes up then be ready for a green week after the long weekend

Market Gives a Hint!!After the delisting of emaar malls today many of the traders got swap shares and many booked the profit. If we read the candles yesterday was first indication that market may sell off. This is the power of technical analysis. Support zones are marked in white lines watch out for a good chart pattern to enter the trade. Wait & watch game for now.
Hit like & follow guys ;)

More Down Side Another most effected was DFM heavy sell of was seen today along with other stocks. Wait for it to react at support zone. For now in a no trading zone.
Hit like & follow guys ; )

The Most EffectedIt was one of the most effected stock in todays sell off, support is still bit far i guess selling pressure will continue for now till support zone is established. Its in a no trading zone do not try to catch a falling knife as i keep saying.
Hit like & follow guys ;)
Gap Filled?Armex can surprise us, a very good bounce from support zone is seen and more upside is expected from here.
Hit like and follow :)

Morning Star?If it opens with a gap up tomorrow we can expect a morning star kind of pattern that is bullish and we can expect more upside, this stock is very powerful and very strong fundamentally as well. Good for long term holding. Over all bullish ;)
Hit like & follow guys ;)

More UpWe can see similar pattern previously after every red candle market pushes up, thursdays candle is positive and buying have again started. I think more upside is expected on this, lets wait for a break of this trend line to sell till thn its good for holding. very bullish after the financial results.
Hit like & follow guys ;)

Another Limit UP?Its holding at the support level for now also we can see a inside day candle - bullish, second gap is already filled a gap before that is not yet filled. If the market is positive and if it goes above 5.38 expect a limit up again. Else we can see some weakness and it come come down to fill up the gap it will but a opportunity - buy the dip!!!
Hit like & follow guys ;)

Buy or WaitWe also want to buy at support and sell at resistance, this is the stock right at the support but to confirm buyers are holding this zone we want to see bullish candle and thn enter the trade. Looks very bullish over all.
Hit like & follow guys ;)

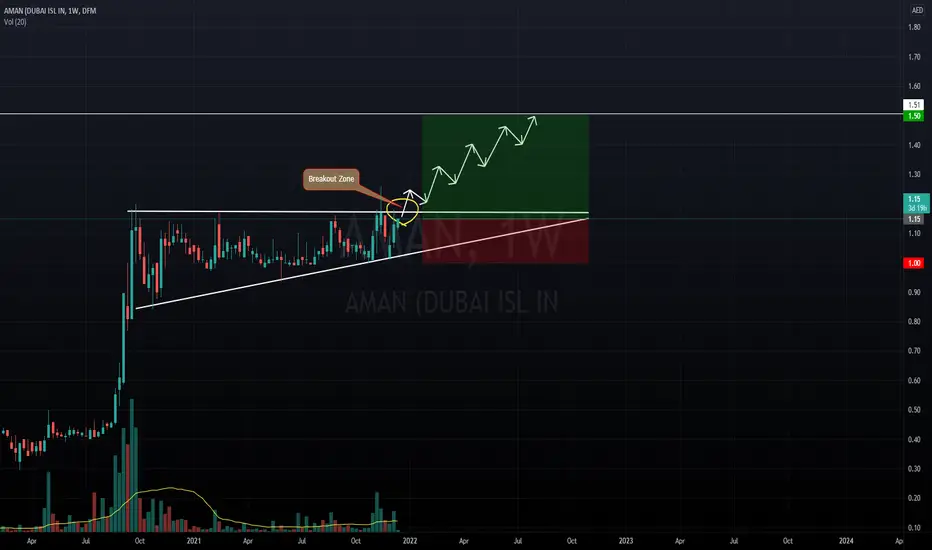
South or North?If we see the bigger picture on a weekly chart, we can see a breakout of a pole and a flag pattern. Yes we can see the breakout already and if the next candle or the last weeks candle can be taken as a retest candle which is a "success" for now then we can expect this stock to move slowly the the next target around 1.45-1.50 level. For now its a breakout, we should see a gap up opening or a flat opening it order for bulls to get activated. A gap down will discourage the buyers and will show weakness. Over all bullish!!
Hit like & follow guys ;)

Will it Fill Up The Gap?Its been performing very well, after a gap up its been in a range. There are chances it might come down to fill the gap. For now its at a very strong resistance that is around 1.57-1.60. We can already see a rejection candle on a weekly chart right at 1.57 for now its in a no trading zone. Over all in a uptrend.
Hit like & follow guys ;)
