Buy DIBAfter the financial report it have been under pressure, however its almost at a very crucial support levels, once we see a nice bullish candle confirming buying have started its good time to enter. Its still in a uptrend!!
hit like & follow guys ;)

Let It Come Down!! Most of the stock in dubai stock market are coming back for a retest which is a good buying opportunity. Emaar is coming down for a retest at a important level and we can by this stock if we had previously missed the breakout. Check out the trade plan below
Entry : 3.60 to 3.64
Stop Loss : 3.50
Target : 4.15
Risk/Reward : 4.45


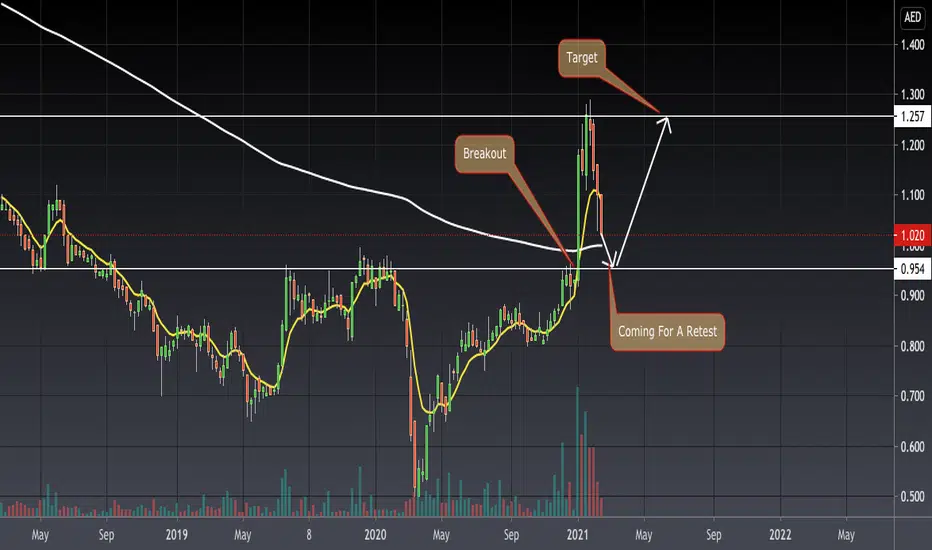
Wait For a RetestIt will soon give a good buying opportunity, as we have to do is wait patiently and look for a bounce at the support/retest area.
Entry : 0.950 to 0.955
Stop loss : 0.865
Target : 1.25
Risk/Reward : 3.75
Hit like & follow guys ;)
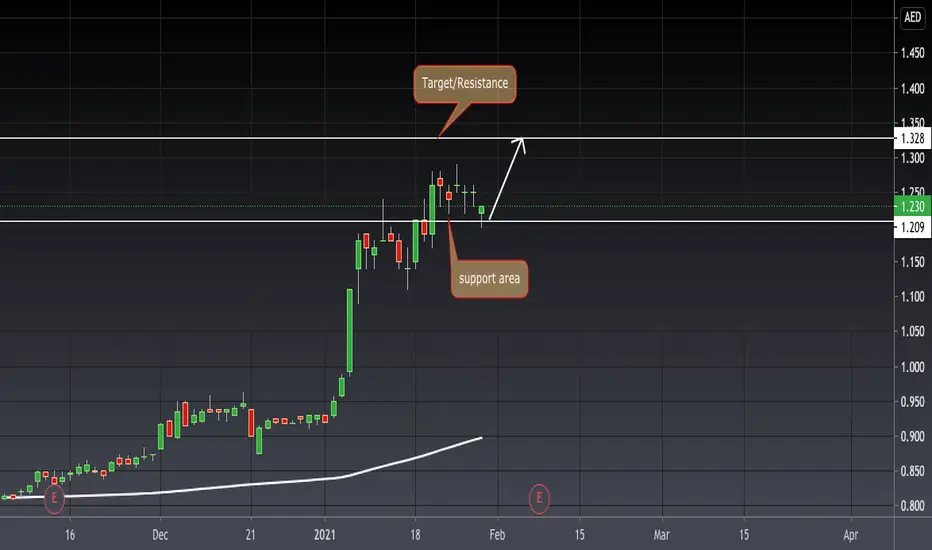
Good For InvestmentIts been performing nice and its in a uptrend, also we can see a breakout and retest of the same levels. A weekly closing is very good with a nice bullish green candle. This stock is good for investment we can achieve the target in 2 to 3 months time.
Entry : 0.655 to 0.660 levels
Stop Loss : 0.618
Target: 0.80
Risk/Reward : 5
Hit like & follow guys ;)


At nice SupportIt have come down after a push phase and now its at a support level. Most likely we can see a doji or a hammer candle indicating buyers are holding it. Over all in a uptrend.
Hit like & follow guys ;)

Ranging A very strong stock and in a strong uptrend as of now its ranging. Good for a buy at the support level that is around 5.00 and upper range that is the resistance level of 5.14 over all in a bullish and uptrend.
Hit like & follow guys ;)

2 ScenariosEmaar is developing a bullish candlestick pattern if tomorrow it opens positive and closes green this is scenario 1 else we go down to strong support area near 3.65 levels. Over all in a uptrend but due to covid market is pushing down.
Hit like & follow guys ;)

Wait and watchIts a good stock and in a uptrend, as of now its retracing down after a push phase. Its coming back to important support level so watch out for a nice bullish candle before you enter the trade. No rush! market will give chance most likely we can see a doji or a hammer candle to see and confirm the support.
Hit like & follow guys ;)

Strong Resistance Its below the resistance levels and its trying hard to cross it. Once it closes above the resistance levels we can buy this and go for a swing positing that is till 0.900 for now its bullish but retracing down. Also we can see its taking support at 50% FIB levels. Most like we can see the uptrend continuation from here.
Hit like & follow guys ;)

Morning Star Pattern??It still looks bullish as its above 200ema and have taken a small bounce. Can this be called a morning star pattern which is bullish!!
Yes!! if we see and positive opening tomorrow and a green closing we can call it a nice morning star pattern and we can take a swing position. Still Bullish!!
Hit like & follow guys ;)

Still in nice UptrendIts still holding the levels amid sell off we can see it have taking a bounce from support level good for intraday. A quick entry and exit recommended.
Hit like & follow guys ;)
GFH long targetwee need to wait the signal either we reach the support line or we break the resistance line the target long deserve to wait.

DIB has two ways!DIB actually can break the roof of the channel and then it would go towards the next channel roof.
But it can goes down because it has a resistance in front of its route. So be careful and wait to determine more accurate.

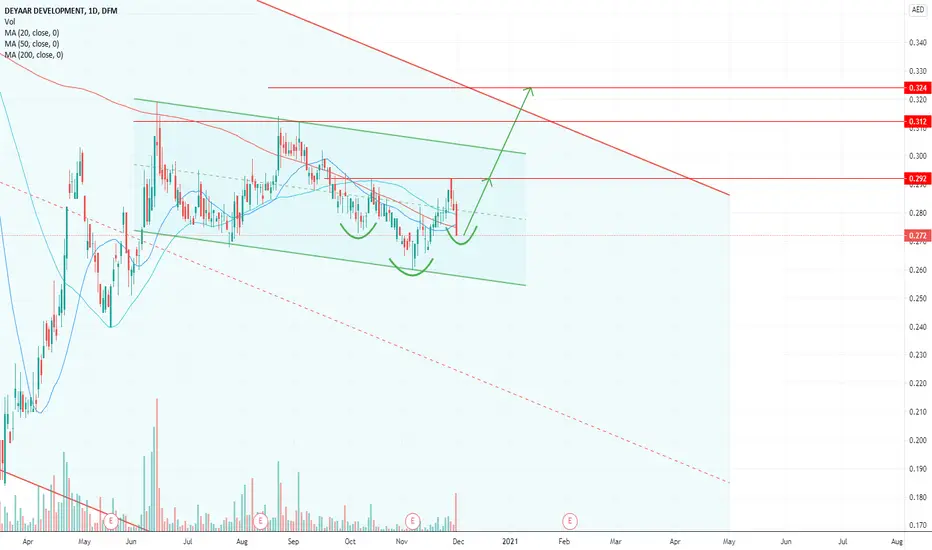
Deyaar Development price predictionDFM:DEYAAR Potential head and shoulders formation, long the break out at 0.292 to target 0.314 and 0.324. A good stock to hold IMO for medium term.
Hit the like button please if you find this useful :)
This is only my own view and not a financial advice, do your own analysis before buying or selling
Happy Trading!
Good ConfirmationA nice pin bar right at the support indicating buyers are activated in that area and pushing the price upside also today with a solid green candle we can have a confirmation that new or fresh buying have started after the profit booking. Over all very bullish!!!
Hit like & follow guys ;)

Nice Bullish MomentumIf you have not purchased GFH today you have missed the train. Very good stock in a bullish mode a nice bullish momentum have again started and now its ready to fly again. After the strong upside momentum we saw a correction and it have retraced exactly at the important FIB levels and it have taken a bounce from the support area. A fresh buying is seen today. Bullish!!
Hit like & follow guys

In a PatternUPP is trading in a pattern as of now there are good chances it can break to the upside. If it breaks to the upside we can have a very good target at around 0.330 to 0.340 area we have to wait and watch the breakout. If you have already entered the trade hold on to it if you are still about to buy thn hold till you see a breakout of this pattern.
Hit like & follow guys ;)

Bullish Candlestick PatternA nice bullish candlestick pattern is seen today that to right at the resistance levels it means buyers are still active and do not want the price to go far from the resistance level there are good chances it can give a breakout of the resistance level as indicated on the chart. A closing above 0.30 will attract more buyers.
Hit like & follow guys ;)

Buy & HoldI have been recommending DFM since so long even before the breakout. Its very bullish with strong fundamentals!! next target is good buy and hold it till you see good profits. Bullish mode!!
Hit like & follow guys ;)

GFH wait for the signaleither you wait for the breakout trend line or enter after the price hits the support area and back to retest the swing high
