Bullish continuing trend Based on the latest data from TradingView, Gulf Pharmaceutical Industries (JULPHAR) is currently trading at 1.33 AED. The stock has shown significant movement, with a 72.06% increase in the last month and a 72.50% increase year-to-date. Recently, JULPHAR experienced a strong bullish trend, breaking above its 200-day Exponential Moving Average (EMA) and surpassing the resistance level of 1.17 AED with robust bullish candles. This pattern indicates a continuing bullish trend.
Considering these factors and employing technical analysis augmented with machine learning techniques, my prediction for JULPHAR's future price is a continued upward trend in the short term. Specifically, I forecast that JULPHAR will reach approximately 1.45 AED in the near future.

AJMAN BANK IN DAYLI CHART Hello to all tradingview investors, according to my previous analysis I see a great opportunity with good probability, the details are reflected in the chart, greetings and good luck to al

JULPHAR | Bullish trend with anticipation of retracementObservation Summary:
Strong bullish Bias. On Jan 15, 2024, this stock got flagged as a volume leader. The price also broke above 200 EMA. Within 2 days, price broke the resistance of 1.17, with strong bullish candles. As per Hieken candles the trend is bullish continuation. Price is heading towards next resistance at 1.41 and 1.49. Price is also respecting the bullish trendline.
Anticipation:
~ Price has made a sudden increase but it is due for correction or retracement. It is aticipated that price might reach 1.49 but then retrace to the region of 1.29 till 1.31.
~ There is bearish divergence seen on 1H, 4H and 1D timeframes.
~ Also bearish divergence is noticed on volumes along with ABCD bearish reversal pattern on 1H.
~ All these signals hint towards price retracement and correction as people will book their profits.
~ But be concious for bullish trendline breakout as a confirmation for divergence.
~ If you have purchased at the time, EMA200 was broken then stay in the trade.
~ If you want to enter, then wait till price tracement goes to 1.29 till 1.31 level.
Trade Plan:
~ PLAN A: Long (@ Market)
~ EN: 1.11, QTY 200
~ SL: 1.05, TP: 1.49, RR: 6.3
~ PLAN B: BUY LIMIT Entry 1.29, QTY 200
~ SL: 1.17, TP2: 1.76, RR: 3.92

EMIRATES CENTRAL C,IN DAYLI CHART Hello to all tradingview investors, according to my previous analysis I see a great opportunity with good probability, the details are reflected in the chart, greetings and good luck to al

APEX INVESTMENT P.S.C IN DAILY CHART Hello to all tradingview investors, according to my previous analysis I see a great opportunity with good probability, the details are reflected in the chart, greetings and good luck to al


ARAM Bullish trend he 4-hour technical analysis for Aram Group on the Abu Dhabi Securities Exchange (ADX) from TradingView provides the following insights:
Oscillators: The summary of oscillators is largely neutral, with a mix of neutral, buy, and strong buy signals. Key oscillators like the Relative Strength Index (RSI) and Stochastic %K show neutral readings, suggesting no strong momentum in either direction.
Moving Averages: The moving averages are predominantly indicating a 'Buy' signal. This includes various types of moving averages like the Exponential Moving Average (EMA), Simple Moving Average (SMA), and others over different periods (10, 20, 50, 100, 200). This trend suggests a general bullish sentiment in the 4-hour timeframe.
Pivot Points: The pivot point analysis offers various support (S1, S2, S3) and resistance (R1, R2, R3) levels based on classic, Fibonacci, Camarilla, Woodie, and DM methods. These can be helpful for identifying potential price targets or reversal points.
Overall Summary: The overall summary of these technical indicators on a 4-hour basis leans towards a 'Buy' recommendation, indicating a bullish trend in the short-term. However, the presence of neutral signals in oscillators suggests some level of uncertainty or potential for volatility.
This analysis indicates that in the short term, Aram Group’s stock might experience bullish behavior

FIRST ABU DHABI BANK IN DAYLI CHART Hello to all tradingview investors, according to my previous analysis I see a great opportunity with good probability, the details are reflected in the chart, greetings and good luck to al

ADAVIATION has a bullish breakoutADAVIATION has a bullish breakout after a long bear spell
Entry right now can be taken to ride the Bull run for this
Its a fundamentally strong stock

Can Waha Capital stock breakout and go above 3.15? Monthly chart, the stock is trading in a long term rising wedge.
After crossing the resistance line (BLUE), the target will be 3.15 or 3.22 depending on the point of breakout.
Note: This is a long term idea.

Ghitha is trading sideways, then targets 63 after crossing upDaily chart, Ghitha Holding (ADX, UAE) stock is trading between the resistance and support (almost a rectangle channel).
It is a good trading opportunity BUY at support, SELL at resistance, until crossing up the resistance (around 49.0), then the target will be 63.0 extending to 70.0
Technical indicators: MACD is positive. RSI indicates some minor correction or sideways movement.

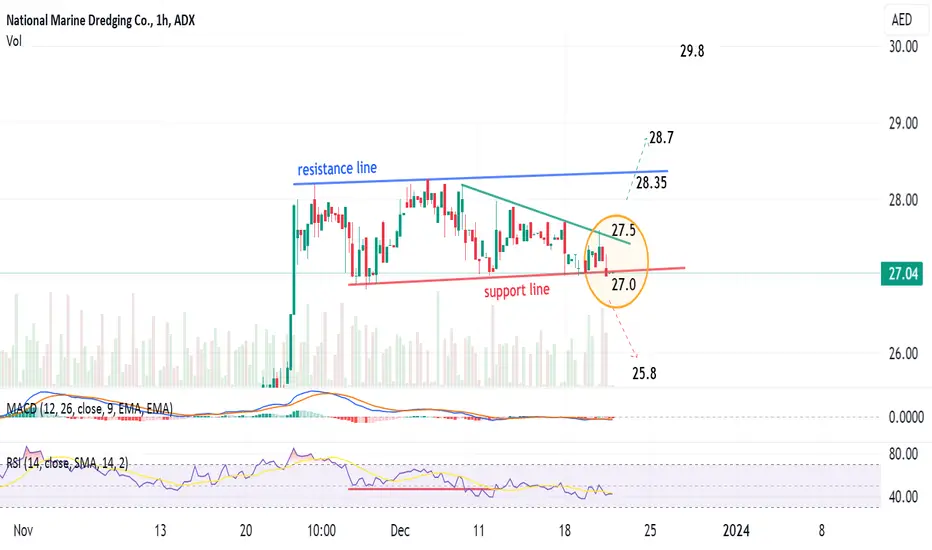
NMDC is trading in a critical level - Be careful!1-hour chart, the stock is almost on the support level, below which the target will be 25.8
Technical Indicators has inverse signals: MACD is negative, RSI is positive!
Above 27.5, the target will be 28.7 then 29.8
ADNOC GAS (ADX), to target 3.82 after crossing resistanceDaily chart, the stock ADNOC GAS is trading between support and resistance lines since mid June 2023.
A Triangle chart pattern is being formed - After the price clearly crosses the resistance line (BLUE), around 3.15 - 3.16, then the target will be 3.82, passing through some resistance levels as shown on the chart.
ENTRY #1 : BUY at touching the support line (RED) around 3.02 - 3.03 and rebounding.
Stop Loss below 3.00
ENTRY #2 : BUY after clear crossing of resistance line (closing 2 days above / or one day and high volume)
Stop loss after breaking down resistance line.

EMIRATES: Buy ideaOn EMIRATES we will have a hight probability to have an uptrend because as you see on the chart we have many springs effects on the vwap indicator.Thanks!

DEWA: Sell ideaOn DEWA as you see on the chart we will have a hight probability to have a downtrend because we have the breakout of vwap and the support line.Thanks!

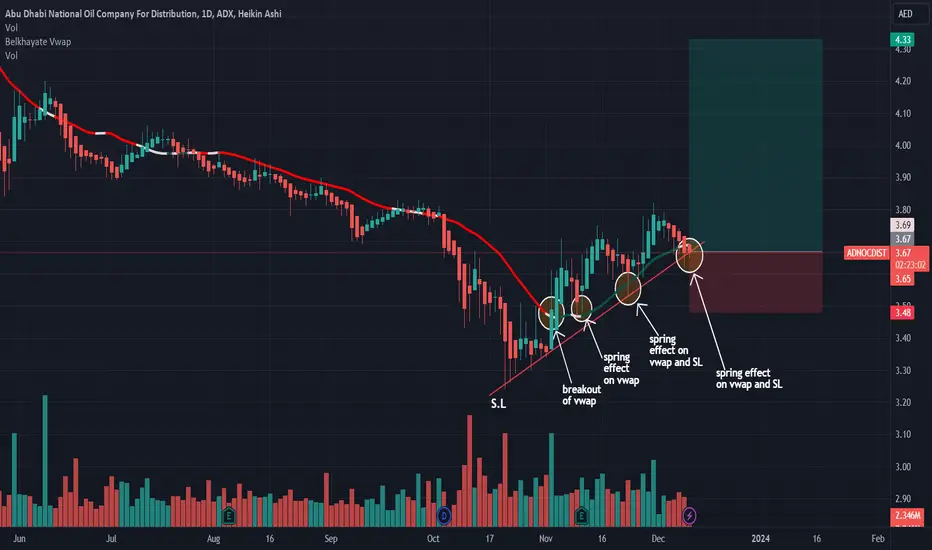
ADNOCDIST: Buy ideaOn ADNOCDIST as you see on the chart we will have a hight probability to have an uptrend because we have many springs effects on vwap and the support line.Thanks!
ADCB: Big probability of downtrendOn ADCB as you see on the chart we will have a big probability to have a downtrend because we have the breakout of the vwap indicator and the support line.Thanks!
Phoenix Group Christmas Gift PHX Min To 3 AEDPHX To 3 AED in short term ( within next days)
PHX To 7 AED long term ( within 6 months )
Not Financial Advice
Do Your Own Analysis

NMDC to target 31 / 32.4 after crossing 28.41-hour chart, NMDC, after crossing the blue line at 28.4, the target will be 31 extended to 32.4
A chart pattern (ascending rectangle) will be formed.
Technical indicators RSI and MACD are supporting this view.
Stop loss 27.5


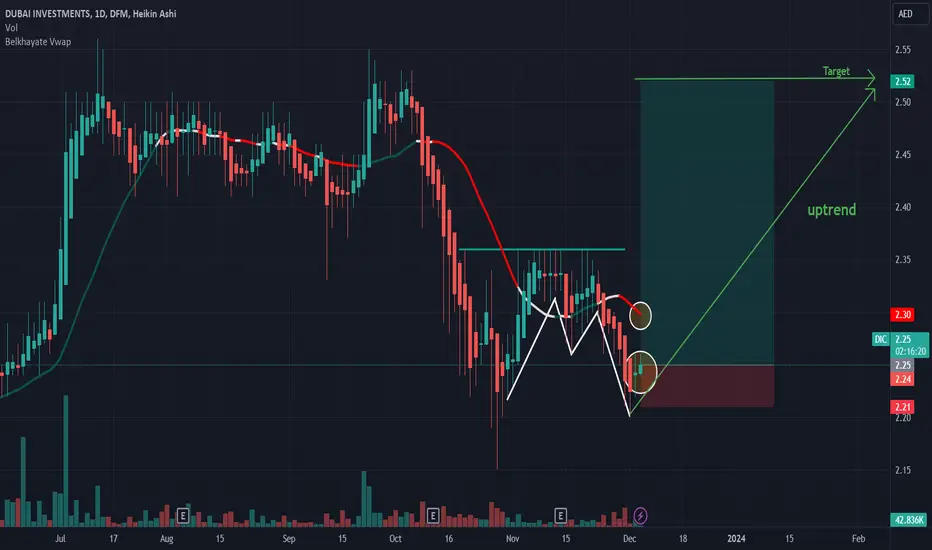
DIC: Buy ideaOn DIC we will have a hight probability to have an uptrend because as you see on the chart we are under the vwap and also we have a candle with small body and long wick.Thanks!
ADNH: Buy ideaOn ADNH we will have a hight probability to have an uptrend as you see on the chart because we can see a little candles with small wicks under the vwap indicator.Thanks!

SALIK: Sell ideaOn SALIK as you see on the chart we have a squeeze so it's mean that we will have a hight probability to have a downtrend.Thanks!
