FRES- Going Long Perhaps not!It's amazing what looking on a larger time frame does, my long FRES position looks like a bad idea, and almost a mirror of what happened not so long ago. A brief bounce off of 800p and a big sell of after. Of course nothing is certain, but I'm revising my exit strategy so to speak (hopefully 860). NOT FINANCIAL ADVICE!!!

FRES- Going Long!Despite a high P/E this is a good pullback on an ascending channel, with MACD and RSI confirming the long buy. I have purchased at 8.27, 1hr puts most recent swing low in at a tight 8.17, lets see if I can sell at 9.17.

OCDO INDUSTRY 4Better potential than anything stateside imo for an industry 4 retailer
Upside huge
We must be wary of a retest of the last low circa 500
Looks to be freeing itself of the downtrend
Bull div
Not broken out I’ll look to add on a pulllback from a breakout
GRI 2023

A future Amazon and potential 5 bagger Pretty sure bottom is in here
We have this IHS plus some nice geometry and tricky pa
Where AMZN nailed cloud these guis are doing Industry 4 sheet: ai/robotics/M2M/ML/IoT
Send it
Sorry muricans your Western tech hegemony is ova
GRI 2023

Breakout for a 2,200%-plus return?This is Carclo, an industrial share listed on the London Stock Exchange’s Alternative Investment Market. It looks like it is breaking out from a 68-month decline that, if the past is any guide, could return huge multiples on any investment at this stage.
Some of this company’s subsidiaries have been trading almost 100 years, but this century it has been a hugely volatile share. It began with the general market decline after the dotcom bubble at the turn of the millennium. A major slide in price was triggered in June 2000, bringing it down almost 90% from peak to trough across 33 months.
It took 26 months for the share to rebound to the 50% Fib (this share loves a Fibonacci level) and, after hitting resistance there, retraced to the .382 Fib where it bobbled along for the best part of a year. By August 2007 it had risen 650% from the bottom.
But then came a double top and another major decline, hitting resistance at the 50% Fib in September 2008 and setting eight months’ worth of relative equal highs from there. (A very nice trading range, that.)
Price reversed again at the .236 Fib and this was where the fun started. Across the next four years, Carclo rose 1,000%, trough to peak.
Since that January 2013 peak, another double top almost 10 years ago to the day, Carclo has been in seemingly terminal decline. There can’t be many bulls left to sell and you get the sense capitulation is around the corner.
Although there was a slight recovery in price from November 2014 to June 2017 (31 months), it met resistance at the .236 Fib and rolled over again. The peak-to-trough decline, at the nadir of the Covid lockdowns in 2020, was 99.19%.
But this is no junk share. It has had its problems with its pension liabilities and with debt but it has arranged new banking facilities with its lenders that give it good headroom. Net assets are almost £30m against a market cap of <£10m.
But the key thing is how *every single time* this share has opened on the monthly above the trendline after a multi-month decline, it has sparked a tremendous rally in price over the medium term. It opened above again yesterday. I’m eyeing as my first TP the 50% Fib on the most recent decline, where there are five months of relative equal highs to mitigate.
From there, a return to the .618 Fib on the broader, 67-month downtrend would also draw price to the monthly swing low and ICT fair-value gap from June 2013, which also remains unmitigated. And if you believe in cups and handles and head-and-shoulders patterns, there’s every reason to believe a C&H and inverse H&S could form very soon.
Hitting the .618 Fib at 317p would constitute a near 2,200% return for anyone investing today. Better still, given the current zeitgeist of war and ageing populations, Carclo’s specialisms (e.g. heavy-duty cabling for the aviation industry and technical plastics for the medical sector) could create a new era of enormous value for the business. Who’s to say it wouldn’t rocket beyond old support-and-resistance levels to make new ATHs?
After all, this share has made big, big moves before.
BUT DYOR. GLA.

FERGUSON ,,, RISING Uptrend
Going toward 13650 , add or enter to this great opportunity.
New SL can be around 10700

Smart Money Buys low ....Again?I have added here today to this chart ...been looking at this lvl,didnt think it would get down here ,but here it is ..more charts to come

Pantheon Resources (PANR) LongPantheon Resources Plc, through its subsidiaries, engages in the exploration and production of oil and gas in the United States.
CONS:
- Earnings have declined by 16.3% per year over past 5 years.
- Highly volatile share price over the past 3 months.
- Makes less than USD$1m in revenue ($0).
- Shareholders have been diluted in the past year.
PROS:
- Whilst currently unprofitable, they have been profitable on average for the past 5 years.
- Debt level is low and not considered a risk.
- They do not pay a dividend.
- At least 3 years of financial data is available.
- High market cap (£370M).
- PANR does not have negative shareholders equity..
- No concerning events have been detected.

The 1. Chapter of Darktrace - 2 Long scenariosTwo scenarios where i plan to go long:
Fundamentals:
Darktrace provides mostly solutions for cyber security and could profit from the current atmosphere (Ukraine etc.)
Scenario 1 (Blue arrow)
Target: Next resistance level (upper red rectangle)
Requirments:
- retake of first resistance level (lower red rectangle)
- generating higher highs on the 1 hour chart after retake
Invalidation:
- Fall under first resistance level (lower red rectangle) after retake AND generating lower low swings on the 1 hour chart
Scenario 2 (Orange arrow)
Target: Next resistance level (line level 1)
Requirments:
- Retest of former s/r level (line level 2)
Invalidation:
Added to long term hold stocks if it should fall deeper
Good luck


Boohoo longPossible double bottom formed.
Wait for confirmation before going in.
What are your thoughts?

ALL triangle forming in upward channelALL looks like +20% is possible near term
no advice given
Triangle formed in upward channel

AXL - very strongAXL very strong in upward channels
No advice given
I have not researched this share
looks good to me

Buy ideaAs you see on the chart we have a buy idea because we can see the spring effect on the vwap indicator and the support line.Big probability of an uptrend.Thanks.

GWA, Time to Evaluate Ones PositionHi guys,
In this analysis I go through the GWA monthly chart.
With price having risen 70%+ since September '22 is it now able to brake the wall its now currently facing or is it wanting to find its way back to the 200ma.
The question now is price going to drop fast or muscle its way back into the higher range and flip the current resistance as support.
My gut tells me we are about to see price decline from this point on till the 200ma is hit or price drops to the lower red brake out zone.
I believe it is a good idea to evaluate ones position at this time.
This analysis is all price action and nothing to do with the fundamentals of the company.
As always Invest smart and with a plan in place.
"capital loss is more hard felt that capital gained"
Stay safe,
Crypto Leonard
P.S. This is NOT finantual advice, if you seek finantual aid seek the help of a licenced professional.

What to Expect for EZJ Ahead of Q4 Earnings?On the hourly chart, EasyJet (EZJ) made a bullish breakout after forming a cup with handle pattern. Buyers may continue to push the EZJ share price forward to 415.3 - 422.6 levels, with 428 - 429.9 levels (August highs) as additional bullish targets.
Breaking down and closing below 399 pence may invalidate the prior hypothesis, causing the EZJ share price to fall further to 392.1 pence, with 381.9 and 371.6 as potential targets for sellers.
EasyJet is expected to earn 0.31 pence per share in the fourth quarter, up from -0.60p in the same period last year. Also, EasyJet's Q4 revenue is predicted to be £2.5 billion, up from £1.22 billion during the previous quarter.

DGE Bullish indicator
1- Falling Wedge formed need to check if it
breakout the trend line then trend will be bullish.
Bearish Indicator.
1- if it breaks the 3426 support it will be in bearish trend

BT Group Plc *safe investment opportunity - low risk*
On the above monthly chart price action prints a higher low following a 80% correction since early 2016. Shortly after a 2:1 stock split. A ‘great buy’ opportunity now exists.
Why Bullish?
1) Regular bullish divergence between price action and the money flow index (MFI) - oscillator on bottom of chart.
2) Trend reversal. A higher low was printed from the crash in price action back in 2009.
3) The 3-month chart below provides a clearer picture of the overall trend between price action support and resistance. Clearly an amazing opportunity.
A buy from 130p is amazing if you can get it. Expecting price action resistance between 160-180.
Target? Around 800. This will take time 5 - 6 years but it beats cash resting in the bank account with no interest like the past 10 years!
3-month chart:

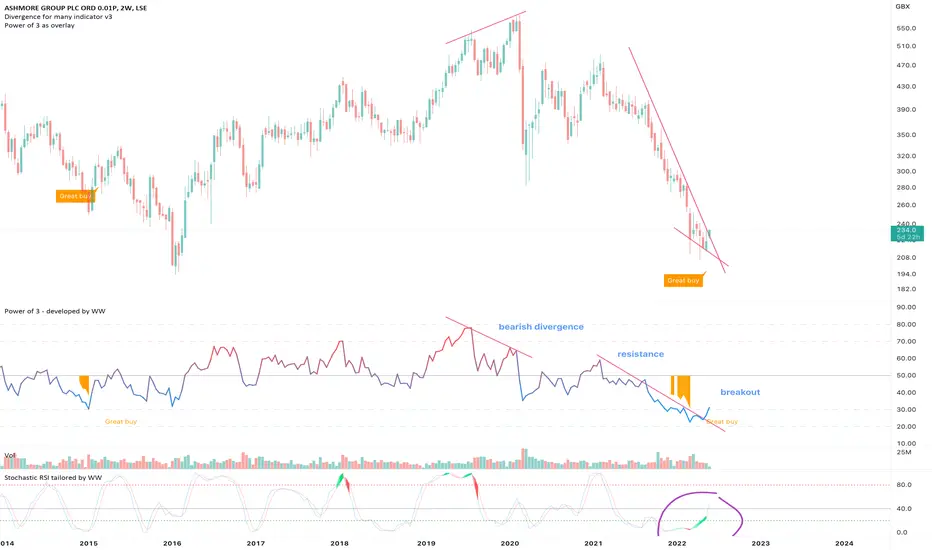
Ashmore Group PlcOn the above 2-week chart price action has corrected 60% since the bearish divergence back in February 2020. Now is an excellent time to be long, why?
1) A buy signal has printed.
2) Regular bullish divergence. 11 oscillators are currently printing bullish divergence with price action.
3) RSI and price action resistance breakout.
4) The 2-day stochastic RSI is crossing up 20 (purple circle) - do not ignore such beautiful signals.
5) Although the monthly candle is yet to close bar a few days, the monthly chart below is worth some attention. Price action is on significant support. Look left. It stands to good reason should price action close at 230-240 in the days towards the end of the month the candle will close green.
6) The last time monthly support was confirmed on this support / resistance level price action appreciated 90% and 150%, respectively. I think it is reasonable to assume a test of the upper channel resistance shall be repeated should this support be confirmed at the end of the month.
Is it possible price action falls further? For sure.
is it probable? No.
Ww
Type: Investment
Risk: <=6% of portfolio
Duration: N/A
Return: 2x
Monthly chart
YCA says the weekly trend is up $YCA since 2020
We now have Higher lows, lower highs, the squeeze is ON.

FERGUSON ,,, RISING It is a good example of a trend and a correction, ending exactly above 50-61.8 fib zone. It is inside an uptrend and the last weekly candle shows next target will be available so soon. Dont forget setting sl for it.


Rio Tinto ,,, Buy opportunity Uptrend
It's a good breakout and starting for a new trend, I suppose nest target will be at about 6800 and as always put SL at a sure place for new buying position.
